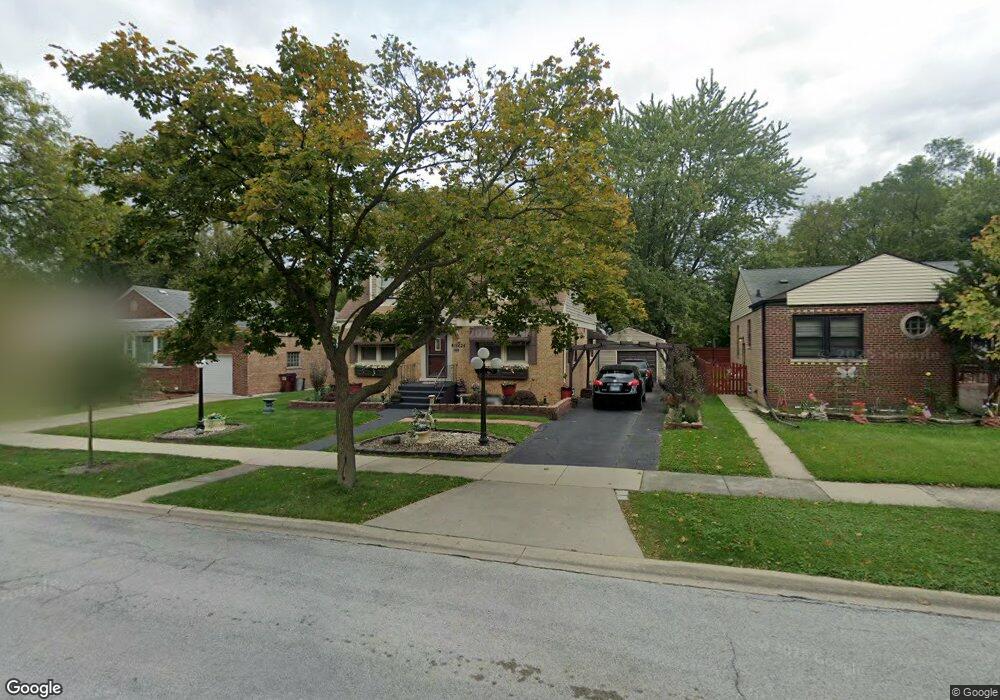
18625 Cowing Ct Homewood, IL 60430
Estimated Value: $218,000 - $259,000
4
Beds
1
Bath
1,428
Sq Ft
$172/Sq Ft
Est. Value
About This Home
This home is located at 18625 Cowing Ct, Homewood, IL 60430 and is currently estimated at $245,148, approximately $171 per square foot. 18625 Cowing Ct is a home located in Cook County with nearby schools including Willow Elementary School, Winston Churchill School, and James Hart School.
Ownership History
Date
Name
Owned For
Owner Type
Purchase Details
Closed on
Feb 15, 2008
Sold by
Va
Bought by
Jeune Andrea C
Current Estimated Value
Home Financials for this Owner
Home Financials are based on the most recent Mortgage that was taken out on this home.
Original Mortgage
$100,000
Outstanding Balance
$62,047
Interest Rate
5.75%
Mortgage Type
VA
Estimated Equity
$183,101
Purchase Details
Closed on
Mar 14, 2006
Sold by
Siemsen
Bought by
Va
Purchase Details
Closed on
Feb 7, 2004
Sold by
Siemsen Patrick
Bought by
Siemsen Patrick and Siemsen Rosalinda
Purchase Details
Closed on
Apr 29, 1996
Sold by
Vancott Kevin J and Vancott Carol S
Bought by
Siemsen Patrick H
Home Financials for this Owner
Home Financials are based on the most recent Mortgage that was taken out on this home.
Original Mortgage
$126,125
Interest Rate
7.86%
Mortgage Type
VA
Create a Home Valuation Report for This Property
The Home Valuation Report is an in-depth analysis detailing your home's value as well as a comparison with similar homes in the area
Home Values in the Area
Average Home Value in this Area
Purchase History
| Date | Buyer | Sale Price | Title Company |
|---|---|---|---|
| Jeune Andrea C | -- | Fatic | |
| Va | -- | None Available | |
| Siemsen Patrick | -- | -- | |
| Siemsen Patrick H | $123,000 | -- |
Source: Public Records
Mortgage History
| Date | Status | Borrower | Loan Amount |
|---|---|---|---|
| Open | Jeune Andrea C | $100,000 | |
| Previous Owner | Siemsen Patrick H | $126,125 |
Source: Public Records
Tax History Compared to Growth
Tax History
| Year | Tax Paid | Tax Assessment Tax Assessment Total Assessment is a certain percentage of the fair market value that is determined by local assessors to be the total taxable value of land and additions on the property. | Land | Improvement |
|---|---|---|---|---|
| 2024 | $6,896 | $20,000 | $3,876 | $16,124 |
| 2023 | $5,746 | $20,000 | $3,876 | $16,124 |
| 2022 | $5,746 | $14,529 | $3,295 | $11,234 |
| 2021 | $5,402 | $14,527 | $3,294 | $11,233 |
| 2020 | $5,354 | $14,527 | $3,294 | $11,233 |
| 2019 | $4,988 | $13,699 | $2,907 | $10,792 |
| 2018 | $4,822 | $13,699 | $2,907 | $10,792 |
| 2017 | $4,863 | $13,699 | $2,907 | $10,792 |
| 2016 | $4,768 | $12,385 | $2,713 | $9,672 |
| 2015 | $4,673 | $12,385 | $2,713 | $9,672 |
| 2014 | $4,611 | $12,385 | $2,713 | $9,672 |
| 2013 | $4,572 | $13,209 | $2,713 | $10,496 |
Source: Public Records
Map
Nearby Homes
- 18526 Dixie Hwy
- 18512 Dixie Hwy
- 1832 187th St
- 18521 Homewood Ave
- 18462 Dixie Hwy
- 2045 Downey Rd
- 18521 Highland Ave
- 2055 Downey Rd
- 2039 Marston Ln
- 18461 Morris Ave
- 18458 Morris Ave
- 1821 Terrace Rd
- 831 Latimer Ln
- 830 Latimer Ln
- 18646 Palmer Cir
- 1741 Evergreen Rd
- 18623 Marshfield Ave
- 18439 Marshfield Ave
- 1940 183rd St Unit 1D
- 18241 Gottschalk Ave
- 18633 Cowing Ct
- 18619 Cowing Ct
- 18637 Cowing Ct
- 18613 Cowing Ct
- 18624 Gottschalk Ave
- 18620 Gottschalk Ave
- 18630 Gottschalk Ave
- 18645 Cowing Ct
- 18607 Cowing Ct
- 18616 Gottschalk Ave
- 18616 Gottschalk Ave
- 18636 Gottschalk Ave
- 18624 Cowing Ct
- 18630 Cowing Ct
- 18620 Cowing Ct
- 18610 Gottschalk Ave
- 18642 Gottschalk Ave
- 18636 Cowing Ct
- 18653 Cowing Ct
- 18545 Cowing Ct