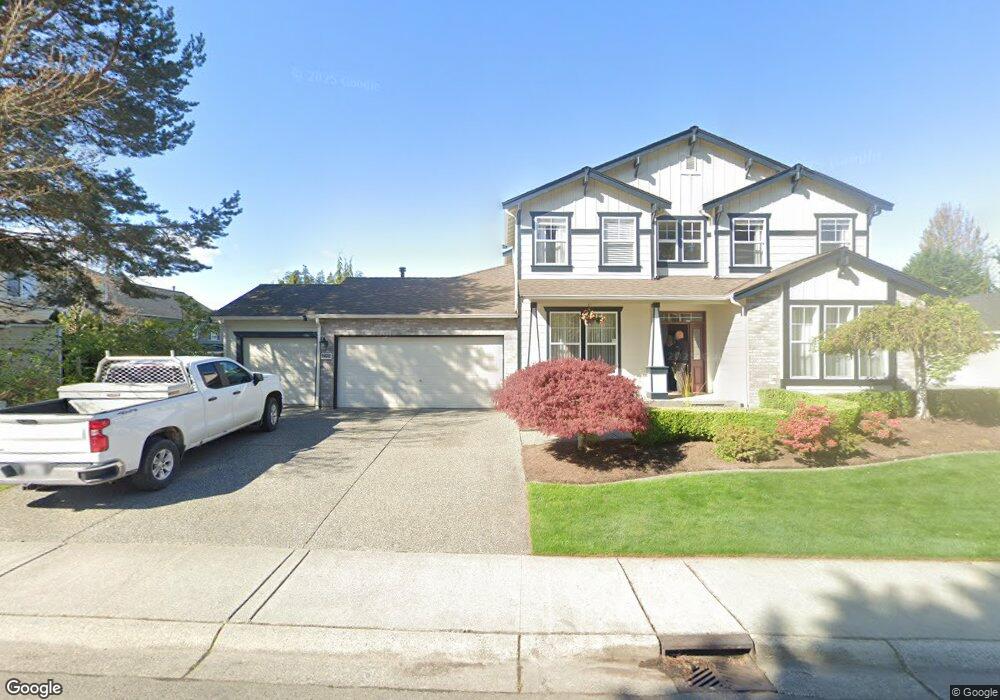
18626 34th Ave SE Bothell, WA 98012
North Creek NeighborhoodEstimated Value: $1,372,000 - $1,489,000
4
Beds
3
Baths
2,899
Sq Ft
$486/Sq Ft
Est. Value
About This Home
This home is located at 18626 34th Ave SE, Bothell, WA 98012 and is currently estimated at $1,409,639, approximately $486 per square foot. 18626 34th Ave SE is a home located in Snohomish County with nearby schools including Canyon Creek Elementary School, Skyview Middle School, and North Creek High School.
Ownership History
Date
Name
Owned For
Owner Type
Purchase Details
Closed on
May 5, 2025
Sold by
Eric R Barben And Yuyu Barben Trust and Barben Eric R
Bought by
Pandey Gyanendra and Dubey Neha
Current Estimated Value
Home Financials for this Owner
Home Financials are based on the most recent Mortgage that was taken out on this home.
Original Mortgage
$1,050,000
Outstanding Balance
$1,039,309
Interest Rate
6%
Mortgage Type
New Conventional
Estimated Equity
$370,330
Purchase Details
Closed on
Nov 24, 2004
Sold by
Eclipse Robert
Bought by
Liu Yuyu
Purchase Details
Closed on
Aug 9, 1999
Sold by
Sshi Llc
Bought by
Eclipse Robert and Liu Yu
Home Financials for this Owner
Home Financials are based on the most recent Mortgage that was taken out on this home.
Original Mortgage
$309,600
Interest Rate
7.12%
Create a Home Valuation Report for This Property
The Home Valuation Report is an in-depth analysis detailing your home's value as well as a comparison with similar homes in the area
Home Values in the Area
Average Home Value in this Area
Purchase History
| Date | Buyer | Sale Price | Title Company |
|---|---|---|---|
| Pandey Gyanendra | $1,400,000 | Chicago Title | |
| Liu Yuyu | -- | Chicago Title Insurance Co | |
| Eclipse Robert | $387,950 | Chicago Title Insurance Co |
Source: Public Records
Mortgage History
| Date | Status | Borrower | Loan Amount |
|---|---|---|---|
| Open | Pandey Gyanendra | $1,050,000 | |
| Previous Owner | Eclipse Robert | $309,600 |
Source: Public Records
Tax History
| Year | Tax Paid | Tax Assessment Tax Assessment Total Assessment is a certain percentage of the fair market value that is determined by local assessors to be the total taxable value of land and additions on the property. | Land | Improvement |
|---|---|---|---|---|
| 2026 | $11,043 | $1,344,600 | $824,400 | $520,200 |
| 2025 | $9,864 | $1,235,000 | $735,000 | $500,000 |
| 2024 | $9,864 | $1,102,700 | $643,000 | $459,700 |
| 2023 | $10,234 | $1,276,000 | $745,000 | $531,000 |
| 2022 | $9,187 | $910,700 | $460,000 | $450,700 |
| 2020 | $8,629 | $807,400 | $420,000 | $387,400 |
| 2019 | $7,595 | $718,500 | $335,000 | $383,500 |
| 2018 | $7,221 | $636,200 | $290,000 | $346,200 |
| 2017 | $6,223 | $557,800 | $235,000 | $322,800 |
| 2016 | $5,993 | $524,300 | $215,000 | $309,300 |
| 2015 | $6,016 | $500,300 | $200,000 | $300,300 |
| 2013 | $5,385 | $398,400 | $162,000 | $236,400 |
Source: Public Records
Map
Nearby Homes
- 18725 35th Dr SE
- 3413 189th Place SE
- 3028 183rd Place SE
- 18632 29th Ave SE
- 18223 31st Ave SE
- 3621 192nd St SE Unit C
- 18501 28th Ave SE
- 18115 34th Dr SE
- 3212 193rd Place SE
- 3121 194th St SE
- 3123 194th St SE
- 3822 194th St SE
- 3126 194th St SE
- 3122 194th St SE
- 18309 26th Dr SE
- 3205 179th Place SE
- 3732 194th SE
- 3809 194th Ln SE
- 3812 194th Ln SE
- 3822 194th Ln SE
- 18619 34th Ave SE
- 18625 34th Ave SE
- 18618 34th Ave SE
- 18615 34th Ave SE
- 3407 187th Place SE
- 18611 34th Ave SE
- 18717 33rd Ave SE
- 3413 187th Place SE
- 18713 33rd Ave SE
- 3319 187th Place SE
- 18610 34th Ave SE
- 3417 187th Place SE
- 18607 34th Ave SE
- 18603 34th Ave SE
- 18717 34th Ave SE
- 18709 33rd Ave SE
- 18721 33rd Ave SE
- 18718 34th Ave SE
- 18602 34th Ave SE
- 3414 187th Place SE
Your Personal Tour Guide
Ask me questions while you tour the home.