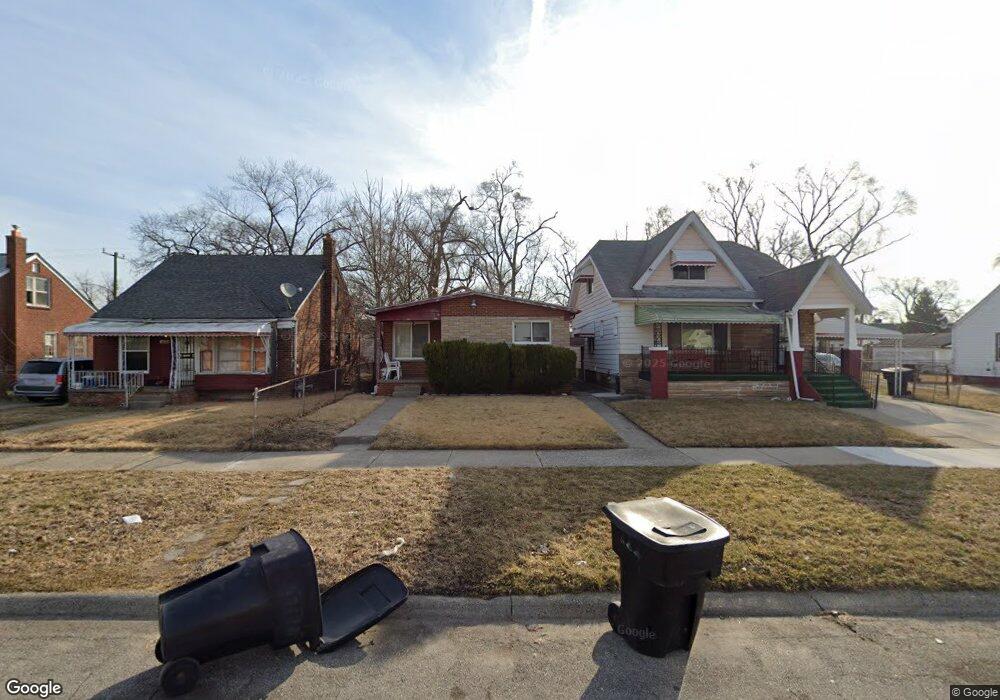
18628 Orleans St Highland Park, MI 48203
Northeast Central District NeighborhoodEstimated Value: $65,000 - $99,391
3
Beds
2
Baths
927
Sq Ft
$85/Sq Ft
Est. Value
About This Home
This home is located at 18628 Orleans St, Highland Park, MI 48203 and is currently estimated at $78,348, approximately $84 per square foot. 18628 Orleans St is a home located in Wayne County with nearby schools including Nolan Elementary/Middle School, Charles L. Spain Elementary-Middle School, and Edward 'Duke' Ellington Conservatory of Music and Art.
Ownership History
Date
Name
Owned For
Owner Type
Purchase Details
Closed on
Nov 10, 2015
Sold by
Treasurer Of The Charter County Of Wayne
Bought by
Mcintyre Linda D
Current Estimated Value
Purchase Details
Closed on
Apr 15, 2009
Sold by
Wells Fargo Bank Na
Bought by
Federal National Mortgage Association
Purchase Details
Closed on
Apr 8, 2009
Sold by
Patterson Lee E
Bought by
Wells Fargo Bank Na
Create a Home Valuation Report for This Property
The Home Valuation Report is an in-depth analysis detailing your home's value as well as a comparison with similar homes in the area
Home Values in the Area
Average Home Value in this Area
Purchase History
| Date | Buyer | Sale Price | Title Company |
|---|---|---|---|
| Mcintyre Linda D | $500 | None Available | |
| Federal National Mortgage Association | -- | None Available | |
| Wells Fargo Bank Na | $60,922 | None Available |
Source: Public Records
Tax History Compared to Growth
Tax History
| Year | Tax Paid | Tax Assessment Tax Assessment Total Assessment is a certain percentage of the fair market value that is determined by local assessors to be the total taxable value of land and additions on the property. | Land | Improvement |
|---|---|---|---|---|
| 2025 | $1,037 | $23,600 | $0 | $0 |
| 2024 | $1,037 | $19,600 | $0 | $0 |
| 2023 | $1,006 | $15,800 | $0 | $0 |
| 2022 | $1,069 | $15,600 | $0 | $0 |
| 2021 | $1,041 | $11,400 | $0 | $0 |
| 2020 | $1,041 | $9,900 | $0 | $0 |
| 2019 | $1,026 | $9,500 | $0 | $0 |
| 2018 | $908 | $9,100 | $0 | $0 |
| 2017 | $161 | $8,500 | $0 | $0 |
| 2016 | $2,126 | $22,900 | $0 | $0 |
| 2015 | $2,490 | $24,900 | $0 | $0 |
| 2013 | $3,108 | $31,082 | $0 | $0 |
| 2010 | -- | $45,570 | $685 | $44,885 |
Source: Public Records
Map
Nearby Homes
- 18615 Orleans St
- 18608 Greeley St
- 19120 Orleans St
- 18134 Dequindre St
- 19183 Riopelle St
- 19174 Marx St
- 18900 Cardoni St
- 18877 Fleming St
- 19222 Riopelle St
- 17888 Marx St
- 18858 Fleming St
- 19249 Riopelle St
- 18888 Fleming St
- 18128 Fleming St
- 18037 Russell St
- 18058 Cardoni St
- 18057 Fleming St
- 19303 Riopelle St
- 18534 Goddard St
- 977 E Brentwood St
- 18634 Orleans St
- 18622 Orleans St
- 18644 Orleans St
- 18610 Orleans St
- 18617 Marx St
- 18633 Marx St
- 18625 Marx St
- 18598 Orleans St
- 18639 Marx St Unit Bldg-Unit
- 18639 Marx St
- 18647 Marx St
- 18603 Marx St
- 18592 Orleans St
- 18800 Orleans St
- 18623 Orleans St
- 18595 Marx St
- 18587 Marx St
- 18805 Marx St
- 18580 Orleans St
- 18818 Orleans St