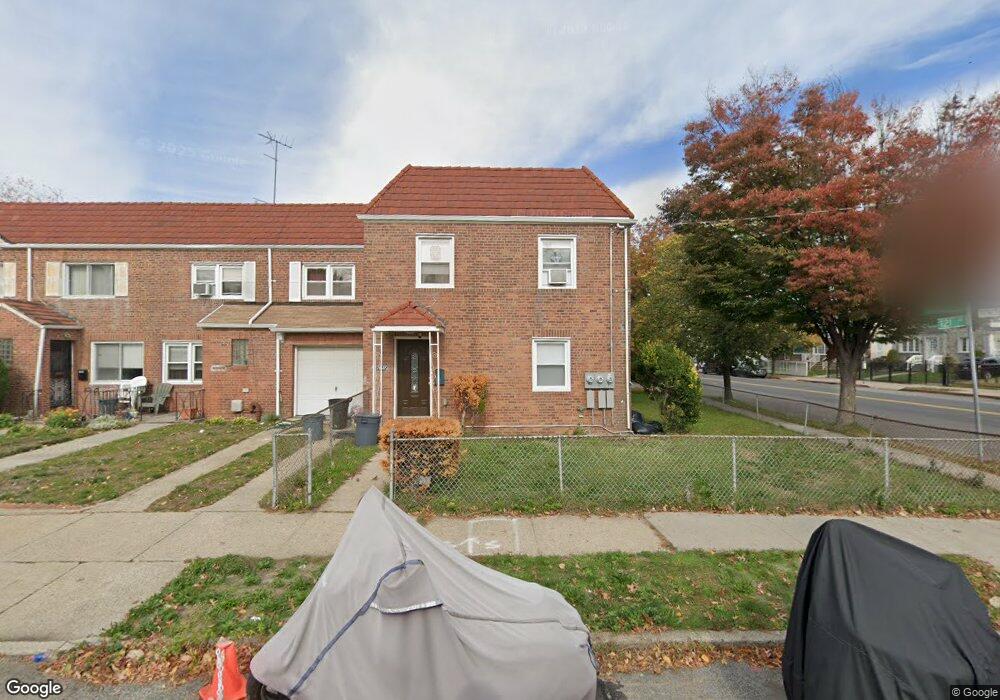
18629 121st Ave Saint Albans, NY 11412
Saint Albans NeighborhoodEstimated Value: $919,000 - $1,055,659
--
Bed
--
Bath
1,980
Sq Ft
$489/Sq Ft
Est. Value
About This Home
This home is located at 18629 121st Ave, Saint Albans, NY 11412 and is currently estimated at $968,915, approximately $489 per square foot. 18629 121st Ave is a home located in Queens County with nearby schools including P.S. 15 Jackie Robinson, Is 59 Springfield Gardens, and Riverton Street Charter School.
Ownership History
Date
Name
Owned For
Owner Type
Purchase Details
Closed on
Mar 25, 2021
Sold by
Albermerle Corp and Apple Development Enterprises Llc
Bought by
St. Hill Quinton
Current Estimated Value
Home Financials for this Owner
Home Financials are based on the most recent Mortgage that was taken out on this home.
Original Mortgage
$753,950
Outstanding Balance
$677,003
Interest Rate
2.8%
Mortgage Type
Purchase Money Mortgage
Estimated Equity
$291,912
Purchase Details
Closed on
Sep 14, 2020
Sold by
Lashley Darryl
Bought by
Albermerle Corp and Apple Development Enterprises Llc
Home Financials for this Owner
Home Financials are based on the most recent Mortgage that was taken out on this home.
Original Mortgage
$409,500
Interest Rate
2.9%
Mortgage Type
New Conventional
Purchase Details
Closed on
Jun 19, 1997
Sold by
Lashley Darryl and Lashley Irwin
Bought by
Lashley Darryl
Create a Home Valuation Report for This Property
The Home Valuation Report is an in-depth analysis detailing your home's value as well as a comparison with similar homes in the area
Home Values in the Area
Average Home Value in this Area
Purchase History
| Date | Buyer | Sale Price | Title Company |
|---|---|---|---|
| St. Hill Quinton | $887,000 | -- | |
| St. Hill Quinton | $887,000 | -- | |
| Albermerle Corp | $460,000 | -- | |
| Albermerle Corp | $460,000 | -- | |
| Lashley Darryl | -- | Ticor Title Guarantee Compan | |
| Lashley Darryl | -- | Ticor Title Guarantee Compan |
Source: Public Records
Mortgage History
| Date | Status | Borrower | Loan Amount |
|---|---|---|---|
| Open | St. Hill Quinton | $753,950 | |
| Closed | St. Hill Quinton | $753,950 | |
| Previous Owner | Albermerle Corp | $409,500 |
Source: Public Records
Tax History Compared to Growth
Tax History
| Year | Tax Paid | Tax Assessment Tax Assessment Total Assessment is a certain percentage of the fair market value that is determined by local assessors to be the total taxable value of land and additions on the property. | Land | Improvement |
|---|---|---|---|---|
| 2025 | $6,157 | $32,492 | $7,749 | $24,743 |
| 2024 | $6,157 | $30,654 | $8,126 | $22,528 |
| 2023 | $6,157 | $30,654 | $8,939 | $21,715 |
| 2022 | $6,073 | $46,560 | $13,980 | $32,580 |
| 2021 | $6,040 | $42,000 | $13,980 | $28,020 |
| 2020 | $5,731 | $36,120 | $13,980 | $22,140 |
| 2019 | $5,344 | $31,080 | $13,980 | $17,100 |
| 2018 | $5,207 | $25,545 | $10,209 | $15,336 |
| 2017 | $5,168 | $25,352 | $10,799 | $14,553 |
| 2016 | $4,781 | $25,352 | $10,799 | $14,553 |
| 2015 | $2,665 | $22,564 | $12,704 | $9,860 |
| 2014 | $2,665 | $21,288 | $12,038 | $9,250 |
Source: Public Records
Map
Nearby Homes
- 17955 Anderson Rd
- 179-50 Anderson Rd
- 179-47 Zoller Rd
- 188-51 120th Rd
- 12133 Grayson St
- 179-01 120th Ave
- 122-22 Nellis St
- 17918 Selover Rd
- 178-10 Leslie Rd
- 17915 Eveleth Rd
- 18822 119th Ave
- 17911 Eveleth Rd
- 12811 Harry Douglass Way
- 11984 178th Place
- 191-07 121st Ave
- 12244 Nellis St
- 19009 122nd Ave
- 12253 Milburn St
- 17836 Eveleth Rd
- 178-26 Zoller Rd
- 186-29 121st Ave
- 18625 121st Ave
- 186-25 121st Ave
- 18623 121st Ave
- 187-10 121st Ave
- 18621 121st Ave
- 186-19 121st Ave
- 18619 121st Ave
- 18619 121st Ave
- 18615 121st Ave
- 12041 Farmers Blvd
- 12037 Farmers Blvd
- 120-41 Farmers Blvd
- 121-07 Farmers Blvd
- 18628 121st Ave
- 18613 121st Ave
- 18624 121st Ave
- 12033 Farmers Blvd
- 18622 121st Ave
- 121-11 Farmers Blvd