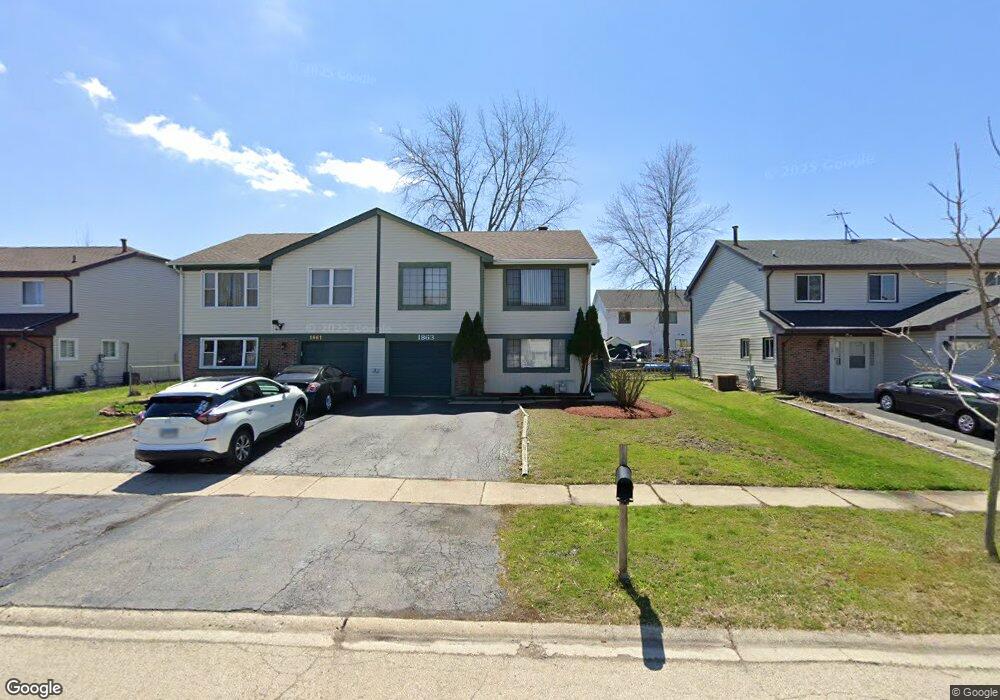
1863 Nautilus Ln Hanover Park, IL 60133
South Tri Village NeighborhoodEstimated Value: $311,000 - $371,000
2
Beds
2
Baths
1,736
Sq Ft
$190/Sq Ft
Est. Value
About This Home
This home is located at 1863 Nautilus Ln, Hanover Park, IL 60133 and is currently estimated at $329,270, approximately $189 per square foot. 1863 Nautilus Ln is a home located in DuPage County with nearby schools including Heritage Lakes Elementary School, Jay Stream Middle School, and Glenbard North High School.
Ownership History
Date
Name
Owned For
Owner Type
Purchase Details
Closed on
Jul 25, 2014
Sold by
Chiero Fred and Chiero Tammy
Bought by
Chiero Fred and Chiero Tammy
Current Estimated Value
Home Financials for this Owner
Home Financials are based on the most recent Mortgage that was taken out on this home.
Original Mortgage
$127,640
Outstanding Balance
$99,328
Interest Rate
4.75%
Mortgage Type
New Conventional
Estimated Equity
$229,942
Purchase Details
Closed on
Sep 20, 2001
Sold by
Johncola Leonard G
Bought by
Chiero Fred and Meschick Tammy
Home Financials for this Owner
Home Financials are based on the most recent Mortgage that was taken out on this home.
Original Mortgage
$147,781
Interest Rate
6.99%
Mortgage Type
FHA
Purchase Details
Closed on
Jan 31, 1997
Sold by
Ferguson Mary Lou and Schroeder Mary Lou
Bought by
Johncola Leonard G
Home Financials for this Owner
Home Financials are based on the most recent Mortgage that was taken out on this home.
Original Mortgage
$103,988
Interest Rate
7.81%
Mortgage Type
FHA
Create a Home Valuation Report for This Property
The Home Valuation Report is an in-depth analysis detailing your home's value as well as a comparison with similar homes in the area
Home Values in the Area
Average Home Value in this Area
Purchase History
| Date | Buyer | Sale Price | Title Company |
|---|---|---|---|
| Chiero Fred | -- | None Available | |
| Chiero Fred | $150,000 | -- | |
| Johncola Leonard G | $113,000 | Collar Counties Title Plant |
Source: Public Records
Mortgage History
| Date | Status | Borrower | Loan Amount |
|---|---|---|---|
| Open | Chiero Fred | $127,640 | |
| Closed | Chiero Fred | $147,781 | |
| Previous Owner | Johncola Leonard G | $103,988 |
Source: Public Records
Tax History Compared to Growth
Tax History
| Year | Tax Paid | Tax Assessment Tax Assessment Total Assessment is a certain percentage of the fair market value that is determined by local assessors to be the total taxable value of land and additions on the property. | Land | Improvement |
|---|---|---|---|---|
| 2024 | $7,037 | $83,999 | $14,847 | $69,152 |
| 2023 | $6,562 | $76,210 | $13,470 | $62,740 |
| 2022 | $6,242 | $68,110 | $12,040 | $56,070 |
| 2021 | $5,991 | $64,660 | $11,430 | $53,230 |
| 2020 | $5,860 | $62,720 | $11,090 | $51,630 |
| 2019 | $5,650 | $60,480 | $10,690 | $49,790 |
| 2018 | $5,336 | $55,390 | $9,790 | $45,600 |
| 2017 | $5,279 | $53,180 | $9,400 | $43,780 |
| 2016 | $4,864 | $47,920 | $8,470 | $39,450 |
| 2015 | $4,686 | $43,610 | $7,710 | $35,900 |
| 2014 | $4,269 | $40,470 | $7,150 | $33,320 |
| 2013 | $4,236 | $41,440 | $7,320 | $34,120 |
Source: Public Records
Map
Nearby Homes
- 1885 Grosse Pointe Ct
- 1824 Isle Royal Ln
- 1925 Grosse Pointe Ct
- 1309 Coldspring Rd Unit 162
- 3867 Springlake Dr
- 2183 Wildwood Ct
- 1390 Merrimac Ln N
- 1358 Woodlake Dr
- 3875 Windjammer Ln
- 1711 Fulton Ln
- 2315 Stepstone Ln
- 1339 Narragansett Dr
- 2320 Bayside Dr
- 1063 Parkview Cir
- 2363 Cove Dr
- 457 Hadley Ct
- 4565 Dupont Dr
- 545 Woodhill Dr Unit 290902
- 2113 Glasgow Ct
- 2119 Glasgow Ct
- 1861 Nautilus Ln
- 1871 Nautilus Ln
- 1853 Nautilus Ln
- 1851 Nautilus Ln
- 1864 Whaler Ln
- 1873 Nautilus Ln
- 1862 Whaler Ln
- 1872 Whaler Ln
- 1854 Whaler Ln
- 1874 Whaler Ln
- 1852 Whaler Ln
- 1843 Nautilus Ln
- 1844 Whaler Ln
- 1841 Nautilus Ln
- 1864 Nautilus Ln
- 1862 Nautilus Ln
- 1872 Nautilus Ln
- 1854 Nautilus Ln
- 1874 Nautilus Ln
- 1842 Whaler Ln