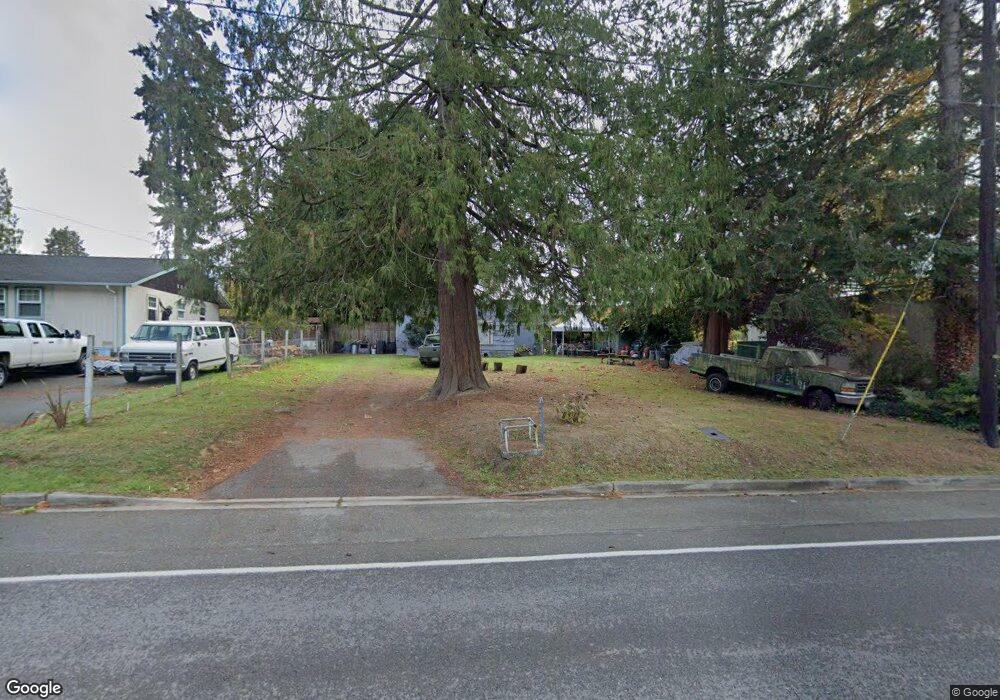
18636 Augusta Ave NE Suquamish, WA 98392
Suquamish NeighborhoodEstimated Value: $250,000 - $317,579
1
Bed
1
Bath
421
Sq Ft
$686/Sq Ft
Est. Value
About This Home
This home is located at 18636 Augusta Ave NE, Suquamish, WA 98392 and is currently estimated at $288,895, approximately $686 per square foot. 18636 Augusta Ave NE is a home located in Kitsap County with nearby schools including Suquamish Elementary School, Kingston Middle School, and Kingston High School.
Ownership History
Date
Name
Owned For
Owner Type
Purchase Details
Closed on
Mar 21, 2017
Sold by
Judd Thomas B
Bought by
Mueller Del and Mueller Kathy
Current Estimated Value
Purchase Details
Closed on
Dec 29, 2005
Sold by
Forsman Leonard and Rice Jana Elizabeth
Bought by
Judd Thomas B
Home Financials for this Owner
Home Financials are based on the most recent Mortgage that was taken out on this home.
Original Mortgage
$88,000
Interest Rate
6.36%
Mortgage Type
Seller Take Back
Purchase Details
Closed on
Aug 31, 1998
Sold by
Hollenback Merle
Bought by
Rice Jana Elizabeth and Forsman Leonard
Home Financials for this Owner
Home Financials are based on the most recent Mortgage that was taken out on this home.
Original Mortgage
$46,000
Interest Rate
6.93%
Mortgage Type
Seller Take Back
Create a Home Valuation Report for This Property
The Home Valuation Report is an in-depth analysis detailing your home's value as well as a comparison with similar homes in the area
Home Values in the Area
Average Home Value in this Area
Purchase History
| Date | Buyer | Sale Price | Title Company |
|---|---|---|---|
| Mueller Del | -- | Fidelity National Title | |
| Judd Thomas B | $110,280 | Pacific Nw Title | |
| Rice Jana Elizabeth | $48,000 | -- |
Source: Public Records
Mortgage History
| Date | Status | Borrower | Loan Amount |
|---|---|---|---|
| Previous Owner | Judd Thomas B | $88,000 | |
| Previous Owner | Rice Jana Elizabeth | $46,000 |
Source: Public Records
Tax History Compared to Growth
Tax History
| Year | Tax Paid | Tax Assessment Tax Assessment Total Assessment is a certain percentage of the fair market value that is determined by local assessors to be the total taxable value of land and additions on the property. | Land | Improvement |
|---|---|---|---|---|
| 2026 | $1,929 | $206,580 | $100,250 | $106,330 |
| 2025 | $1,929 | $206,580 | $100,250 | $106,330 |
| 2024 | $1,504 | $163,270 | $82,320 | $80,950 |
| 2023 | $1,525 | $163,270 | $82,320 | $80,950 |
| 2022 | $1,306 | $131,420 | $68,600 | $62,820 |
| 2021 | $1,233 | $113,500 | $59,100 | $54,400 |
| 2020 | $1,190 | $108,270 | $56,460 | $51,810 |
| 2019 | $1,116 | $101,340 | $52,770 | $48,570 |
| 2018 | $1,049 | $84,160 | $52,770 | $31,390 |
| 2017 | $1,051 | $84,160 | $52,770 | $31,390 |
| 2016 | $1,071 | $78,970 | $52,770 | $26,200 |
| 2015 | $1,060 | $78,970 | $52,770 | $26,200 |
| 2014 | -- | $77,670 | $52,770 | $24,900 |
| 2013 | -- | $77,670 | $52,770 | $24,900 |
Source: Public Records
Map
Nearby Homes
- 18689 1st Ave NE
- 19313 Harris Ave NE
- 18872 Augusta Ave NE
- 18610 5th Ave NE
- 18971 Soundview Blvd NE
- 17711 Division Ave NE
- 6712 NE Geneva St
- 17274 Angeline Ave NE
- 0 Augusta Ave NE Unit NWM2412417
- 18952 Brockton Ave NE
- 6705 NE Prospect St
- 6615 NE Maple St
- 6508 NE Plum St
- 7249 1&2 NE Pebble Beach Dr
- 17691 Division Ave NE
- 17655 Division Ave NE
- 19777 View Terrace NE
- 17880 Purves Ave NE
- 16790 Agate Point Rd NE
- 20593 Chief Sealth Dr NE
- 7250 NE Center St
- 18667 Harris St NE
- 18660 Augusta Ave NE
- 7253 NE Center St
- 13 Lot Augusta Ave NE
- 18701 Harris St NE
- 18648 Harris Ave NE
- 18590 Augusta Ave NE
- 18615 Augusta Ave NE
- 18727 Augusta Ave NE
- 18741 Harris St NE
- 18684 Harris St NE
- 18646 Harris Ave NE
- 18646 Harris Ave NE Unit B
- 18535 Harris St NE
- 18714 Augusta Ave NE
- 18648 Harris St NE
- 18684 Harris Ave NE
- 18639 Angeline Ave NE
- 18730 Augusta Ave NE