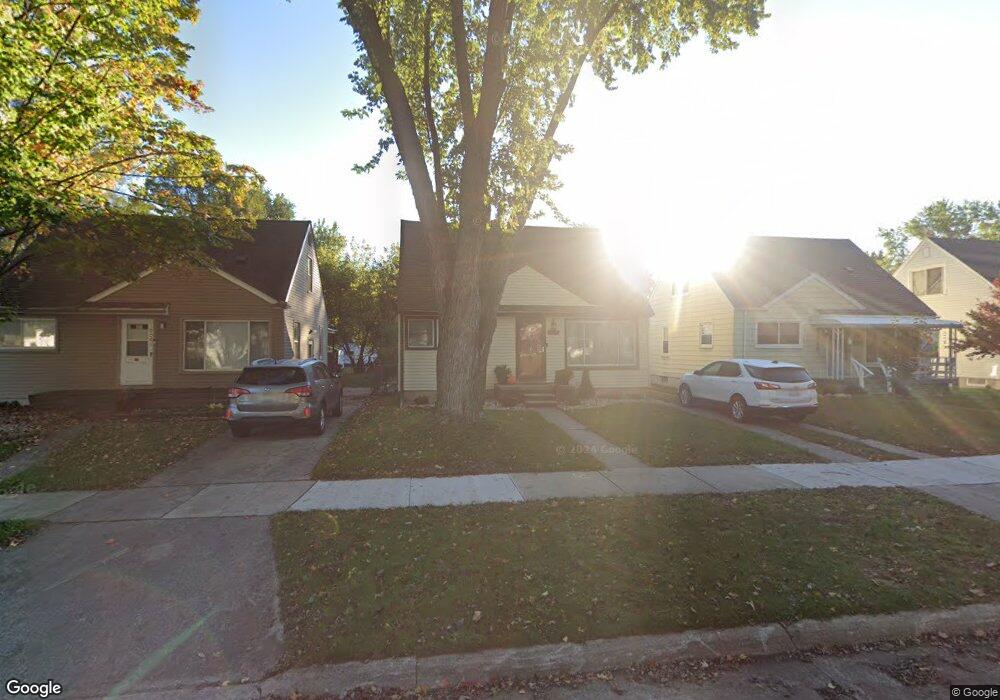
18638 Indian Unit Bldg-Unit Redford, MI 48240
Estimated Value: $158,000 - $172,000
--
Bed
1
Bath
1,071
Sq Ft
$155/Sq Ft
Est. Value
About This Home
This home is located at 18638 Indian Unit Bldg-Unit, Redford, MI 48240 and is currently estimated at $166,110, approximately $155 per square foot. 18638 Indian Unit Bldg-Unit is a home located in Wayne County with nearby schools including Beech Elementary School, Hilbert Middle School, and Redford Union High School.
Ownership History
Date
Name
Owned For
Owner Type
Purchase Details
Closed on
Feb 10, 2025
Sold by
Racine James N
Bought by
Devries Eric
Current Estimated Value
Purchase Details
Closed on
Sep 14, 2018
Sold by
Hotsinpiller Nicole
Bought by
Racine James N
Purchase Details
Closed on
Nov 17, 2014
Sold by
Lupo Nicole
Bought by
Hotsinpiller Nicole and Hotsinpiller Shawn
Purchase Details
Closed on
Nov 11, 2009
Sold by
Harvey Frank M and Harvey Karyn S
Bought by
Federal National Mortgage Association
Purchase Details
Closed on
Sep 17, 1997
Sold by
Anna M and Hinber Robert R
Bought by
Harvey Frank M and Harvey Karyn S
Create a Home Valuation Report for This Property
The Home Valuation Report is an in-depth analysis detailing your home's value as well as a comparison with similar homes in the area
Home Values in the Area
Average Home Value in this Area
Purchase History
| Date | Buyer | Sale Price | Title Company |
|---|---|---|---|
| Devries Eric | $162,500 | Shield Title | |
| Devries Eric | $162,500 | Shield Title | |
| Racine James N | $94,500 | Reputation First Title Agenc | |
| Hotsinpiller Nicole | -- | None Available | |
| Federal National Mortgage Association | $90,353 | None Available | |
| Harvey Frank M | $83,900 | -- |
Source: Public Records
Tax History Compared to Growth
Tax History
| Year | Tax Paid | Tax Assessment Tax Assessment Total Assessment is a certain percentage of the fair market value that is determined by local assessors to be the total taxable value of land and additions on the property. | Land | Improvement |
|---|---|---|---|---|
| 2025 | $1,099 | $72,100 | $0 | $0 |
| 2024 | $1,099 | $65,900 | $0 | $0 |
| 2023 | $1,048 | $56,900 | $0 | $0 |
| 2022 | $2,545 | $49,600 | $0 | $0 |
| 2021 | $2,474 | $47,200 | $0 | $0 |
| 2020 | $2,627 | $43,000 | $0 | $0 |
| 2019 | $2,584 | $35,900 | $0 | $0 |
| 2018 | $599 | $29,700 | $0 | $0 |
| 2017 | $1,986 | $27,500 | $0 | $0 |
| 2016 | $1,591 | $26,100 | $0 | $0 |
| 2015 | $2,154 | $23,600 | $0 | $0 |
| 2013 | $2,150 | $22,400 | $0 | $0 |
| 2012 | $1,505 | $25,300 | $6,100 | $19,200 |
Source: Public Records
Map
Nearby Homes