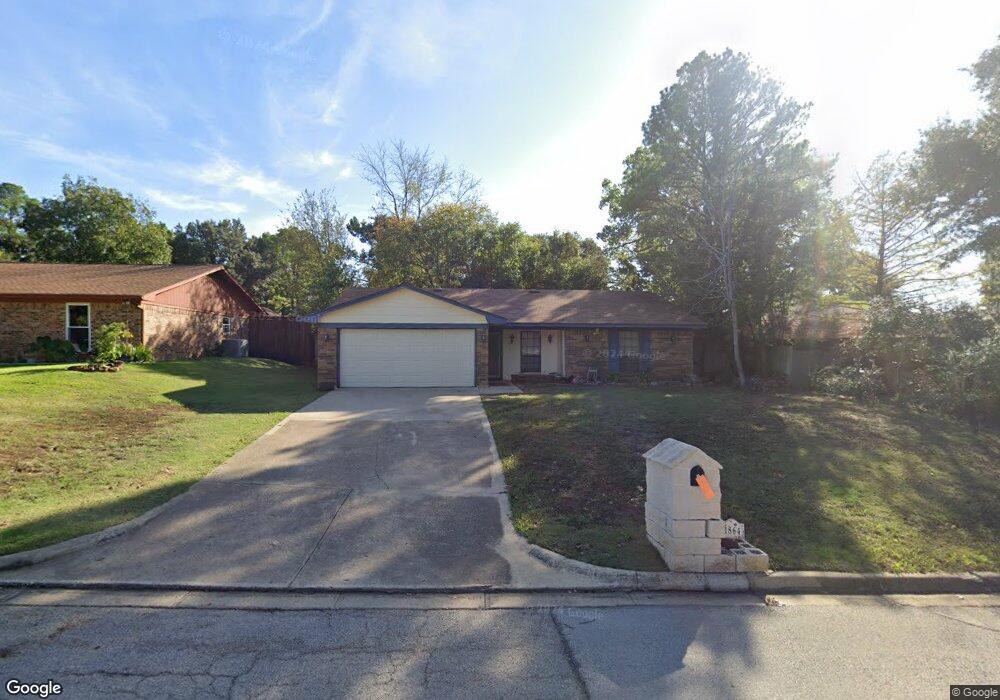
1864 Cimarron Trail Grapevine, TX 76051
Estimated Value: $370,685 - $414,000
3
Beds
2
Baths
1,311
Sq Ft
$301/Sq Ft
Est. Value
About This Home
This home is located at 1864 Cimarron Trail, Grapevine, TX 76051 and is currently estimated at $394,921, approximately $301 per square foot. 1864 Cimarron Trail is a home located in Tarrant County with nearby schools including Dove Elementary School, Grapevine Middle, and Grapevine High School.
Ownership History
Date
Name
Owned For
Owner Type
Purchase Details
Closed on
Jan 20, 2009
Sold by
Hedden Barbara
Bought by
Lussier Mark
Current Estimated Value
Purchase Details
Closed on
May 24, 2001
Sold by
Ethington Kimberly and Elliott Kimberly E
Bought by
Lussier Mark and Hedden Lussier Barbara
Home Financials for this Owner
Home Financials are based on the most recent Mortgage that was taken out on this home.
Original Mortgage
$92,800
Interest Rate
7.07%
Purchase Details
Closed on
Feb 19, 1996
Sold by
Elliott Scott A
Bought by
Elliott Kimberly E
Purchase Details
Closed on
Sep 1, 1993
Sold by
Cisneros Henry G
Bought by
Elliott Scott A and Elliott Kimberly E
Home Financials for this Owner
Home Financials are based on the most recent Mortgage that was taken out on this home.
Original Mortgage
$81,627
Interest Rate
7.23%
Mortgage Type
FHA
Create a Home Valuation Report for This Property
The Home Valuation Report is an in-depth analysis detailing your home's value as well as a comparison with similar homes in the area
Home Values in the Area
Average Home Value in this Area
Purchase History
| Date | Buyer | Sale Price | Title Company |
|---|---|---|---|
| Lussier Mark | -- | None Available | |
| Lussier Mark | -- | Rattikin Title Co | |
| Elliott Kimberly E | $600 | -- | |
| Elliott Scott A | -- | -- |
Source: Public Records
Mortgage History
| Date | Status | Borrower | Loan Amount |
|---|---|---|---|
| Previous Owner | Lussier Mark | $92,800 | |
| Previous Owner | Elliott Scott A | $81,627 | |
| Closed | Lussier Mark | $11,600 |
Source: Public Records
Tax History Compared to Growth
Tax History
| Year | Tax Paid | Tax Assessment Tax Assessment Total Assessment is a certain percentage of the fair market value that is determined by local assessors to be the total taxable value of land and additions on the property. | Land | Improvement |
|---|---|---|---|---|
| 2025 | $3,236 | $294,643 | $75,000 | $219,643 |
| 2024 | $3,236 | $330,000 | $75,000 | $255,000 |
| 2023 | $5,249 | $326,245 | $70,000 | $256,245 |
| 2022 | $5,640 | $308,435 | $50,000 | $258,435 |
| 2021 | $5,627 | $258,778 | $50,000 | $208,778 |
| 2020 | $5,271 | $249,717 | $50,000 | $199,717 |
| 2019 | $4,968 | $251,381 | $50,000 | $201,381 |
| 2018 | $1,177 | $198,053 | $50,000 | $148,053 |
| 2017 | $4,164 | $209,011 | $50,000 | $159,011 |
| 2016 | $3,785 | $211,665 | $50,000 | $161,665 |
| 2015 | $3,116 | $148,800 | $25,000 | $123,800 |
| 2014 | $3,116 | $148,800 | $25,000 | $123,800 |
Source: Public Records
Map
Nearby Homes
- 1831 Cimarron Trail
- 1902 Shorewood Dr
- 2138 Sierra Dr
- 1723 Autumn Ridge Ln
- 2211 Sierra Dr
- 1827 Sonnet Dr
- 1507 Cimarron Trail
- 1092 Rosewood Dr
- 1650 Hyland Greens Dr
- 1641 Choteau Cir
- 1654 Choteau Cir
- 1916 Everglade Ct
- 1626 Choteau Cir
- 6011 Laurel Ln
- 6007 Laurel Ln
- 1323 Dublin St
- 2092 Holt Way
- 1508 Bennington Ct
- 2081 Holt Way
- 2093 Holt Way
- 1870 Cimarron Trail
- 1858 Cimarron Trail
- 2022 Hood Ridge Ct
- 2028 Hood Ridge Ct
- 1876 Cimarron Trail
- 2016 Hood Ridge Ct
- 1867 Cimarron Ct
- 1848 Cimarron Trail
- 1842 Cimarron Trail
- 1893 Cimarron Trail
- 1886 Cimarron Trail
- 2010 Hood Ridge Ct
- 1861 Cimarron Trail
- 1855 Cimarron Trail
- 2030 Hood Ridge Ct
- 1873 Cimarron Ct
- 1849 Cimarron Trail
- 1895 Cimarron Trail
- 2023 Hood Ridge Ct
- 2029 Hood Ridge Ct