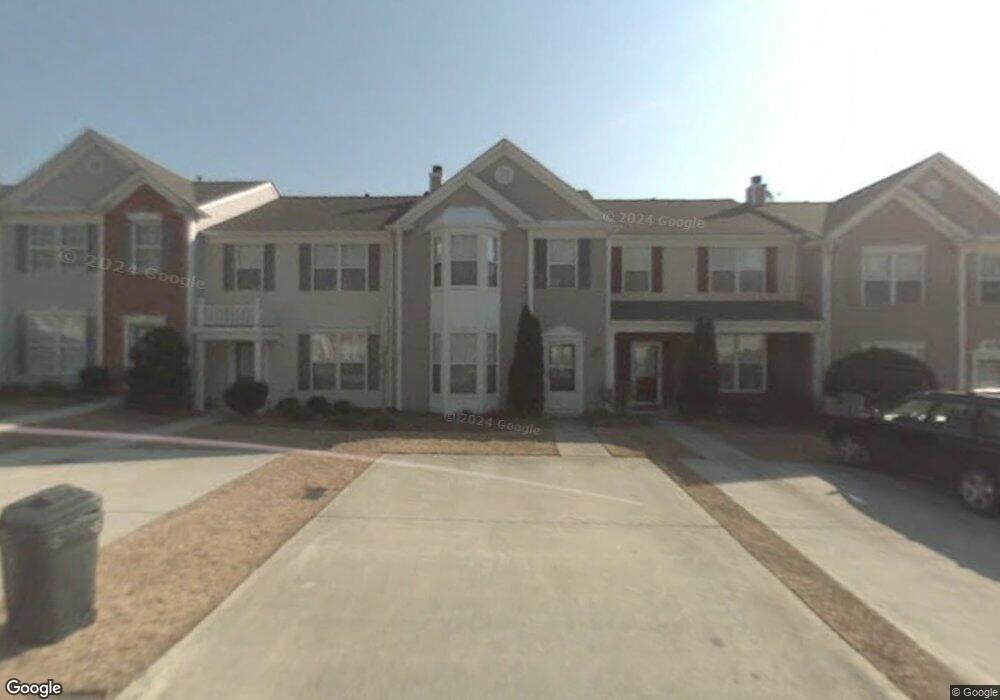
1864 Stancrest Trace NW Unit 2 Kennesaw, GA 30152
Estimated Value: $286,773 - $297,000
3
Beds
3
Baths
1,494
Sq Ft
$195/Sq Ft
Est. Value
About This Home
This home is located at 1864 Stancrest Trace NW Unit 2, Kennesaw, GA 30152 and is currently estimated at $291,193, approximately $194 per square foot. 1864 Stancrest Trace NW Unit 2 is a home located in Cobb County with nearby schools including Hayes Elementary School, Pine Mountain Middle School, and Kennesaw Mountain High School.
Ownership History
Date
Name
Owned For
Owner Type
Purchase Details
Closed on
Nov 29, 2006
Sold by
Townsend Darren S
Bought by
Kanji Axim N
Current Estimated Value
Home Financials for this Owner
Home Financials are based on the most recent Mortgage that was taken out on this home.
Original Mortgage
$138,000
Outstanding Balance
$82,315
Interest Rate
6.36%
Mortgage Type
New Conventional
Estimated Equity
$208,878
Purchase Details
Closed on
May 29, 2002
Sold by
Rosenthal Avraham
Bought by
Townsend Darren S
Home Financials for this Owner
Home Financials are based on the most recent Mortgage that was taken out on this home.
Original Mortgage
$122,084
Interest Rate
6.85%
Mortgage Type
FHA
Purchase Details
Closed on
Dec 13, 2000
Sold by
Pulte Home Corp
Bought by
Rosenthal Avraham
Home Financials for this Owner
Home Financials are based on the most recent Mortgage that was taken out on this home.
Original Mortgage
$98,910
Interest Rate
7.79%
Mortgage Type
New Conventional
Create a Home Valuation Report for This Property
The Home Valuation Report is an in-depth analysis detailing your home's value as well as a comparison with similar homes in the area
Home Values in the Area
Average Home Value in this Area
Purchase History
| Date | Buyer | Sale Price | Title Company |
|---|---|---|---|
| Kanji Axim N | $138,000 | -- | |
| Townsend Darren S | $124,000 | -- | |
| Rosenthal Avraham | $109,900 | -- |
Source: Public Records
Mortgage History
| Date | Status | Borrower | Loan Amount |
|---|---|---|---|
| Open | Kanji Axim N | $138,000 | |
| Previous Owner | Townsend Darren S | $122,084 | |
| Previous Owner | Rosenthal Avraham | $98,910 |
Source: Public Records
Tax History Compared to Growth
Tax History
| Year | Tax Paid | Tax Assessment Tax Assessment Total Assessment is a certain percentage of the fair market value that is determined by local assessors to be the total taxable value of land and additions on the property. | Land | Improvement |
|---|---|---|---|---|
| 2025 | $2,575 | $111,212 | $24,000 | $87,212 |
| 2024 | $2,577 | $111,212 | $24,000 | $87,212 |
| 2023 | $1,565 | $89,568 | $14,000 | $75,568 |
| 2022 | $2,124 | $89,568 | $14,000 | $75,568 |
| 2021 | $1,701 | $70,240 | $14,000 | $56,240 |
| 2020 | $1,638 | $67,376 | $14,000 | $53,376 |
| 2019 | $1,403 | $56,652 | $10,400 | $46,252 |
| 2018 | $1,403 | $56,652 | $10,400 | $46,252 |
| 2017 | $1,148 | $48,848 | $12,800 | $36,048 |
| 2016 | $1,149 | $48,848 | $12,800 | $36,048 |
| 2015 | $1,179 | $48,848 | $12,800 | $36,048 |
| 2014 | $950 | $40,824 | $0 | $0 |
Source: Public Records
Map
Nearby Homes
- 1891 Stancrest Trace NW
- 1706 Pardee Dr
- 1736 Stanwood Dr NW
- 1791 Heights Cir NW
- 1741 Stanwood Dr NW
- 1737 Taynton Cir NW
- 1527 Anna Ruby Ln NW
- 1511 Dolcetto Trace NW Unit 1
- 1360 Raven Rock Trail NW
- 2030 Del Lago Cir NW Unit 8
- 1629 Marsanne Terrace NW Unit 28
- 1629 Marsanne Terrace NW
- 1919 Barrett Knoll Cir NW
- 2031 Lakeshore Overlook Dr NW
- 2168 Del Lago Cir NW Unit 6
- 2155 Del Lago Cir NW Unit 11
- 1999 Barrett Knoll Cir NW
- 1781 Waterside Dr NW Unit 8
- 1862 Stancrest Trace NW
- 1866 Stancrest Trace NW
- 1868 Stancrest Trace NW
- 1860 Stancrest Trace NW
- 1860 Stancrest Trace NW
- 1870 Stancrest Trace NW
- 1708 Stanwood Dr NW
- 1708 Stanwood Dr NW Unit 1708
- 1858 Stancrest Trace NW
- 1858 Stancrest Trace NW Unit 1858
- 1706 Stanwood Dr NW
- 1704 Stanwood Dr NW
- 1704 Stanwood Dr NW Unit 1704
- 1867 Stancrest Trace NW
- 1710 Stanwood Dr NW
- 1865 Stancrest Trace NW
- 1702 Stanwood Dr NW
- 1702 Stanwood Dr NW Unit 1702
- 1700 Stanwood Dr NW
- 1700 Stanwood Dr NW Unit N/A