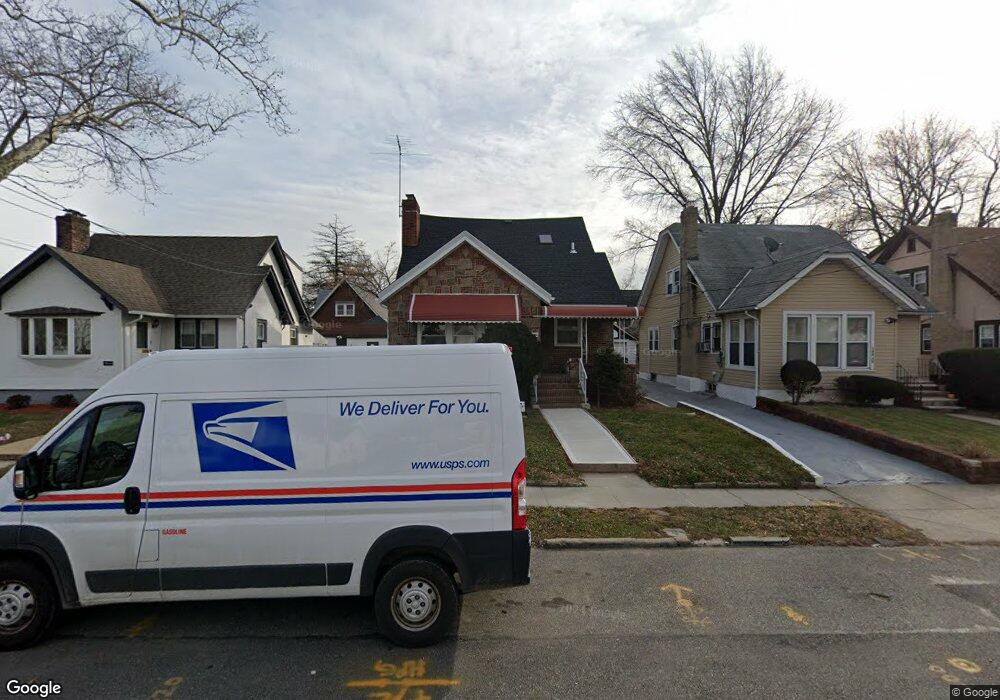
18640 Ilion Ave Saint Albans, NY 11412
Hollis NeighborhoodEstimated Value: $663,067 - $753,000
--
Bed
--
Bath
1,508
Sq Ft
$481/Sq Ft
Est. Value
About This Home
This home is located at 18640 Ilion Ave, Saint Albans, NY 11412 and is currently estimated at $725,267, approximately $480 per square foot. 18640 Ilion Ave is a home located in Queens County with nearby schools including P.S. 118 Lorraine Hansberry, I.S. 192 The Linden, and Riverton Street Charter School.
Ownership History
Date
Name
Owned For
Owner Type
Purchase Details
Closed on
Oct 30, 2017
Sold by
Green Stone Homes Llc
Bought by
Scott Cynthia A and Scott Deonroy
Current Estimated Value
Home Financials for this Owner
Home Financials are based on the most recent Mortgage that was taken out on this home.
Original Mortgage
$613,679
Outstanding Balance
$511,499
Interest Rate
3.83%
Mortgage Type
New Conventional
Estimated Equity
$213,768
Purchase Details
Closed on
Mar 3, 2017
Sold by
Falco Esq As Referee Lorraine P
Bought by
Green Stone Homes Llc
Purchase Details
Closed on
Jul 20, 2007
Sold by
Thomas Joanne and Thomas Judy
Bought by
Thomas Joanne
Purchase Details
Closed on
Sep 20, 1996
Sold by
Rite Properties Ltd
Bought by
Thomas Joanne and Thomas Judy
Home Financials for this Owner
Home Financials are based on the most recent Mortgage that was taken out on this home.
Original Mortgage
$158,700
Interest Rate
7.75%
Mortgage Type
FHA
Create a Home Valuation Report for This Property
The Home Valuation Report is an in-depth analysis detailing your home's value as well as a comparison with similar homes in the area
Home Values in the Area
Average Home Value in this Area
Purchase History
| Date | Buyer | Sale Price | Title Company |
|---|---|---|---|
| Scott Cynthia A | $625,000 | -- | |
| Green Stone Homes Llc | $275,000 | -- | |
| Thomas Joanne | -- | -- | |
| Thomas Joanne | -- | -- | |
| Thomas Joanne | $159,000 | First American Title Ins Co | |
| Thomas Joanne | $159,000 | First American Title Ins Co |
Source: Public Records
Mortgage History
| Date | Status | Borrower | Loan Amount |
|---|---|---|---|
| Open | Scott Cynthia A | $613,679 | |
| Previous Owner | Thomas Joanne | $158,700 | |
| Closed | Thomas Joanne | $0 |
Source: Public Records
Tax History Compared to Growth
Tax History
| Year | Tax Paid | Tax Assessment Tax Assessment Total Assessment is a certain percentage of the fair market value that is determined by local assessors to be the total taxable value of land and additions on the property. | Land | Improvement |
|---|---|---|---|---|
| 2025 | $5,831 | $29,290 | $8,886 | $20,404 |
| 2024 | $4,016 | $29,030 | $8,721 | $20,309 |
| 2023 | $5,831 | $29,030 | $8,857 | $20,173 |
| 2022 | $5,475 | $35,400 | $12,960 | $22,440 |
| 2021 | $5,445 | $35,940 | $12,960 | $22,980 |
| 2020 | $5,166 | $32,220 | $12,960 | $19,260 |
| 2019 | $5,061 | $32,880 | $12,960 | $19,920 |
| 2018 | $4,932 | $24,192 | $10,819 | $13,373 |
| 2017 | $4,659 | $22,853 | $11,670 | $11,183 |
| 2016 | $4,310 | $22,853 | $11,670 | $11,183 |
| 2015 | $2,441 | $20,340 | $14,400 | $5,940 |
| 2014 | $2,441 | $20,160 | $14,400 | $5,760 |
Source: Public Records
Map
Nearby Homes
- 186-16 Hilburn Ave
- 188-07 Mangin Ave
- 18823 Mangin Ave
- 188-25 Mangin Ave
- 187-44 Jordan Ave
- 183-34 Fonda Ave
- 18833 Keeseville Ave
- 188-31 Jordan Ave
- 183-29 Brinkerhoff Ave
- 111-06 Farmers Blvd
- 183-12 Elmira Ave
- 11176 180th St
- 187-23 Brinkerhoff Ave
- 19022 111th Rd
- 179-07 Murdock Ave
- 18908 114th Rd
- 183-09 Dunlop Ave
- 188-45 Quencer Rd
- 183-67 Dunlop Ave
- 112- 2 178th St
- 186-40 Llion Ave
- 18640 Ilion Ave
- 18636 Ilion Ave
- 18644 Ilion Ave
- 18644A Ilion Ave Unit 186-44A
- 18644 Ilion Ave
- 18632 Ilion Ave
- 18637 Jordan Ave
- 18647 Jordan Ave
- 18633 Jordan Ave
- 18647 Jordan Ave
- 18647 Jordan Ave Unit 2
- 18628 Ilion Ave
- 18629 Jordan Ave
- 18639 Ilion Ave
- 18624 Ilion Ave
- 18704 Ilion Ave
- 18635 Ilion Ave
- 11118 Mayville St
- 18625 Jordan Ave