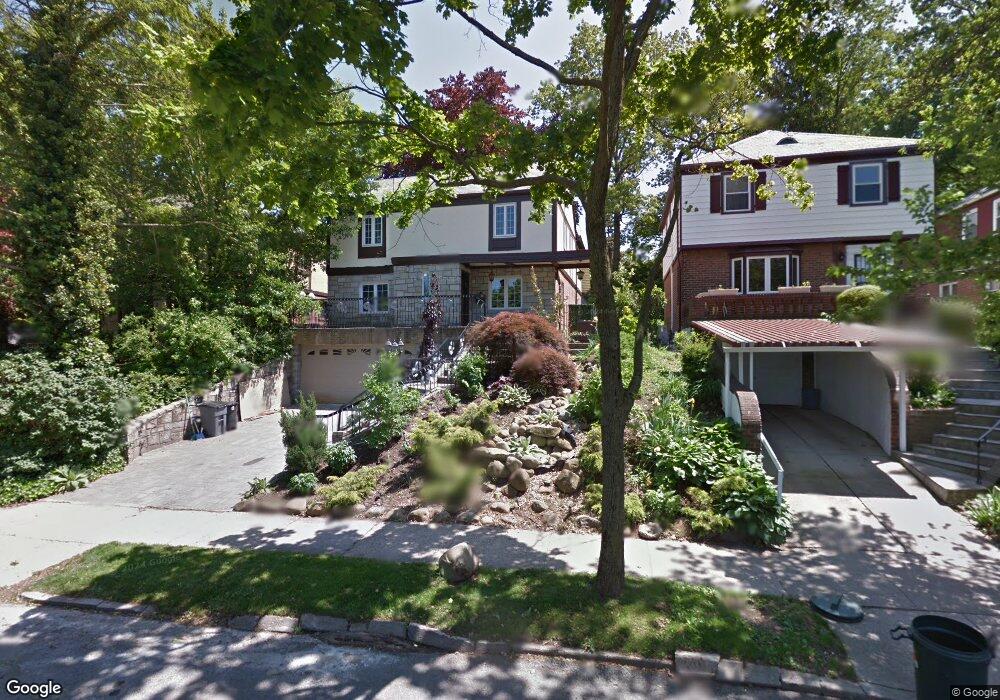
18646 Radnor Rd Jamaica, NY 11432
Jamaica Estates NeighborhoodEstimated Value: $1,309,229 - $1,727,000
--
Bed
--
Bath
2,176
Sq Ft
$698/Sq Ft
Est. Value
About This Home
This home is located at 18646 Radnor Rd, Jamaica, NY 11432 and is currently estimated at $1,519,057, approximately $698 per square foot. 18646 Radnor Rd is a home located in Queens County with nearby schools including P.S. I.S. 178 The Holliswood School, George J. Ryan Middle School 216, and Immaculate Conception Catholic Academy.
Ownership History
Date
Name
Owned For
Owner Type
Purchase Details
Closed on
Jan 19, 2012
Sold by
Chaimov Lyudmila and Chaimov Reginald
Bought by
Davydov Aleksandr
Current Estimated Value
Home Financials for this Owner
Home Financials are based on the most recent Mortgage that was taken out on this home.
Original Mortgage
$499,000
Outstanding Balance
$339,282
Interest Rate
3.96%
Mortgage Type
New Conventional
Estimated Equity
$1,179,775
Purchase Details
Closed on
Aug 8, 2007
Sold by
A S P Realty Corp
Bought by
Chaimov Lyudmila and Chaimov Reginald
Home Financials for this Owner
Home Financials are based on the most recent Mortgage that was taken out on this home.
Original Mortgage
$650,000
Interest Rate
6.78%
Mortgage Type
Purchase Money Mortgage
Purchase Details
Closed on
Jan 14, 1998
Sold by
Friedman Gertrude
Bought by
A S P Realty Corp
Create a Home Valuation Report for This Property
The Home Valuation Report is an in-depth analysis detailing your home's value as well as a comparison with similar homes in the area
Home Values in the Area
Average Home Value in this Area
Purchase History
| Date | Buyer | Sale Price | Title Company |
|---|---|---|---|
| Davydov Aleksandr | $700,000 | -- | |
| Davydov Aleksandr | $700,000 | -- | |
| Chaimov Lyudmila | $830,000 | -- | |
| Chaimov Lyudmila | $830,000 | -- | |
| A S P Realty Corp | $240,000 | -- | |
| A S P Realty Corp | $240,000 | -- |
Source: Public Records
Mortgage History
| Date | Status | Borrower | Loan Amount |
|---|---|---|---|
| Open | Davydov Aleksandr | $499,000 | |
| Closed | Davydov Aleksandr | $499,000 | |
| Previous Owner | Chaimov Lyudmila | $650,000 |
Source: Public Records
Tax History Compared to Growth
Tax History
| Year | Tax Paid | Tax Assessment Tax Assessment Total Assessment is a certain percentage of the fair market value that is determined by local assessors to be the total taxable value of land and additions on the property. | Land | Improvement |
|---|---|---|---|---|
| 2025 | $12,798 | $67,543 | $21,399 | $46,144 |
| 2024 | $12,798 | $63,720 | $25,801 | $37,919 |
| 2023 | $12,883 | $64,142 | $21,777 | $42,365 |
| 2022 | $12,080 | $74,820 | $24,180 | $50,640 |
| 2021 | $12,439 | $71,640 | $24,180 | $47,460 |
| 2020 | $12,049 | $61,620 | $24,180 | $37,440 |
| 2019 | $11,560 | $64,920 | $24,180 | $40,740 |
| 2018 | $10,599 | $53,452 | $19,148 | $34,304 |
| 2017 | $9,980 | $50,428 | $19,827 | $30,601 |
| 2016 | $9,771 | $50,428 | $19,827 | $30,601 |
| 2015 | $5,518 | $48,603 | $24,771 | $23,832 |
| 2014 | $5,518 | $47,216 | $26,050 | $21,166 |
Source: Public Records
Map
Nearby Homes
- 186-31 Radnor Rd
- 18631 Radnor Rd
- 186-15 Grand Central Pkwy
- 184-46 Aberdeen Rd
- 81-22 Haddon St
- 8515 Kent St
- 81-48 192nd St
- 182-27 Grand Central Pkwy
- 184-51 Hovenden Rd
- 80-47 188th St
- 186-35 80th Dr
- 80-50 189th St
- 193-03 85th Rd
- 80-48 190th St
- 18547 80th Rd
- 18019 Grand Central Pkwy
- 195-12 Mclaughlin Ave
- 8012 188th St
- 80-11 190th St
- 180-24 Grand Central Pkwy
- 186-42 Radnor Rd
- 18642 Radnor Rd
- 18650 Radnor Rd
- 18638 Radnor Rd
- 18649 Avon Rd
- 8416 188th St
- 18634 Radnor Rd
- 18639 Avon Rd
- 8647 188th St
- 18630 Radnor Rd
- 18629 Avon Rd
- 18639 Radnor Rd
- 18629 Avon Rd
- 18626 Radnor Rd
- 18626 Radnor Rd
- 18635 Radnor Rd
- 8322 188th St
- 8322 188th St
- 8322 188th St
- 186-54 Avon Rd