
Seller's Agent in 2019
Kit Wilcox
CENTURY 21 Tucker Swanson
(309) 368-0100
127 in this area
169 Total Sales
Estimated Value: $1,471,370
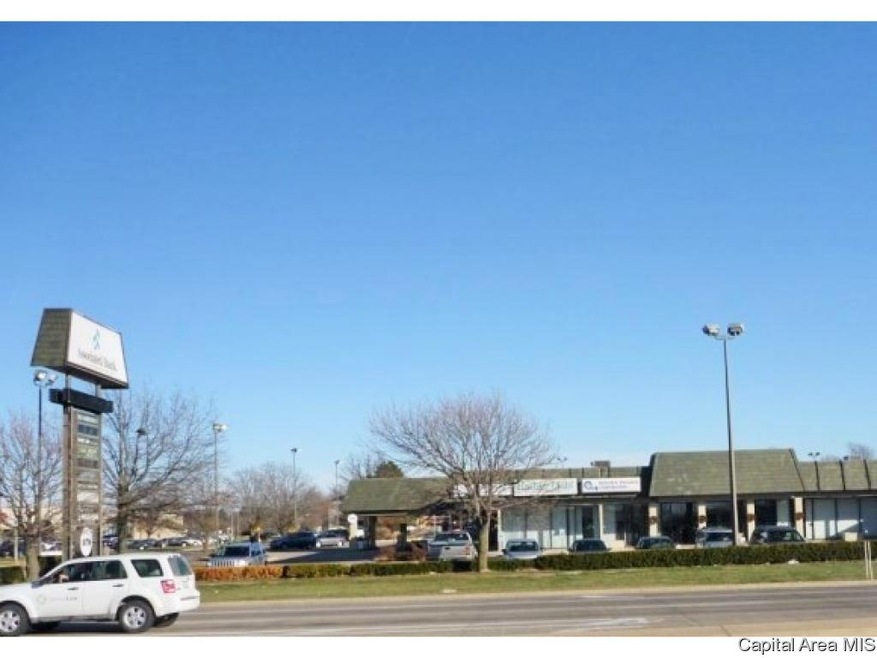
Commercial/Office and Retail Space.
Last Agent to Sell the Property
CENTURY 21 Tucker Swanson License #475099856 Listed on: 02/27/2019
Property Type
Other
Est. Annual Taxes
$36,483
Lot Details
0
| Date | Buyer | Sale Price | Title Company |
|---|---|---|---|
| Lucky 7979 Llc | $930,000 | Western Illinois Title |
| Date | Event | Price | List to Sale | Price per Sq Ft |
|---|---|---|---|---|
| 02/28/2019 02/28/19 | Sold | $930,000 | 0.0% | $31 / Sq Ft |
| 02/27/2019 02/27/19 | Pending | -- | -- | -- |
| 02/27/2019 02/27/19 | For Sale | $930,000 | -- | $31 / Sq Ft |
| Year | Tax Paid | Tax Assessment Tax Assessment Total Assessment is a certain percentage of the fair market value that is determined by local assessors to be the total taxable value of land and additions on the property. | Land | Improvement |
|---|---|---|---|---|
| 2024 | $36,483 | $393,210 | $221,540 | $171,670 |
| 2023 | $36,483 | $380,720 | $214,500 | $166,220 |
| 2022 | $36,082 | $380,720 | $214,500 | $166,220 |
| 2021 | $34,951 | $359,170 | $202,360 | $156,810 |
| 2020 | $35,521 | $359,170 | $202,360 | $156,810 |
| 2019 | $35,805 | $359,170 | $202,360 | $156,810 |
| 2018 | $34,644 | $348,710 | $196,470 | $152,240 |
| 2017 | $34,936 | $348,710 | $196,470 | $152,240 |
| 2015 | -- | $343,560 | $193,570 | $149,990 |
| 2013 | $30,970 | $347,030 | $195,530 | $151,500 |
Seller's Agent in 2019
Kit Wilcox
CENTURY 21 Tucker Swanson
(309) 368-0100
127 in this area
169 Total Sales
Buyer's Agent in 2019
Dena May St. George
CENTURY 21 Tucker Swanson
(309) 335-4454
133 in this area
197 Total Sales
Source: RMLS Alliance
MLS Number: RMACA191145
APN: 99-03-152-009
Disclaimer: Certain information contained herein is derived from information provided by parties other than Homes.com. All information provided is deemed reliable, but is not guaranteed to be accurate and should be independently verified.
![]() IDX information is provided exclusively for personal, non-commercial use, and may not be used for any purpose other than to identify prospective properties consumers may be interested in purchasing. Information is deemed reliable but not guaranteed.
IDX information is provided exclusively for personal, non-commercial use, and may not be used for any purpose other than to identify prospective properties consumers may be interested in purchasing. Information is deemed reliable but not guaranteed.