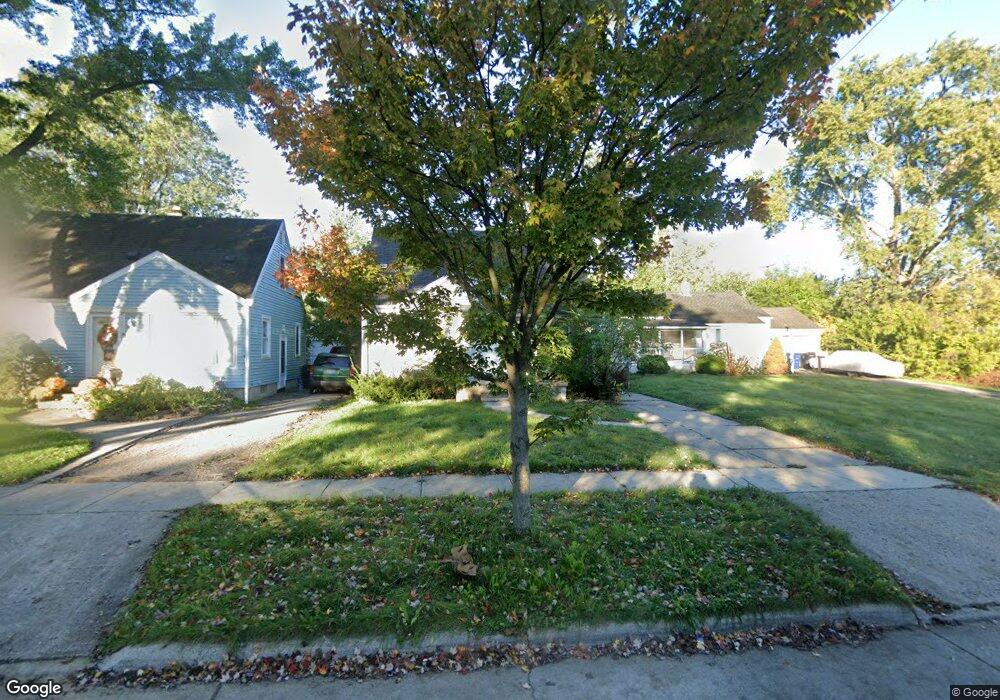
18653 Indian Redford, MI 48240
Estimated Value: $154,463 - $191,000
3
Beds
1
Bath
1,050
Sq Ft
$159/Sq Ft
Est. Value
About This Home
This home is located at 18653 Indian, Redford, MI 48240 and is currently estimated at $167,366, approximately $159 per square foot. 18653 Indian is a home located in Wayne County with nearby schools including Beech Elementary School, Hilbert Middle School, and Redford Union High School.
Ownership History
Date
Name
Owned For
Owner Type
Purchase Details
Closed on
Jun 29, 2021
Sold by
Sharp Annette Duke and Estate Of Ronnie Duke
Bought by
Sharp Annette Duke
Current Estimated Value
Purchase Details
Closed on
Sep 3, 2010
Sold by
Gundersen Jack S and Gundersen Jennifer
Bought by
Duke Ronnie
Purchase Details
Closed on
Jun 7, 2002
Sold by
Gunderson Jack S
Bought by
Gunderson Jack S
Purchase Details
Closed on
Jun 27, 2001
Sold by
Wilson Tonja V
Bought by
Gunderson Jack S
Purchase Details
Closed on
Dec 22, 1998
Sold by
Hunt Ethan
Bought by
Wilson Tonja
Purchase Details
Closed on
Apr 24, 1996
Sold by
Malaj Ilir and Malaj Dritan
Bought by
Kelly A Brazzil
Create a Home Valuation Report for This Property
The Home Valuation Report is an in-depth analysis detailing your home's value as well as a comparison with similar homes in the area
Home Values in the Area
Average Home Value in this Area
Purchase History
| Date | Buyer | Sale Price | Title Company |
|---|---|---|---|
| Sharp Annette Duke | -- | None Available | |
| Duke Ronnie | $31,700 | Title One Inc | |
| Gunderson Jack S | -- | -- | |
| Gunderson Jack S | $115,500 | -- | |
| Wilson Tonja | $89,500 | -- | |
| Kelly A Brazzil | $72,000 | -- |
Source: Public Records
Tax History Compared to Growth
Tax History
| Year | Tax Paid | Tax Assessment Tax Assessment Total Assessment is a certain percentage of the fair market value that is determined by local assessors to be the total taxable value of land and additions on the property. | Land | Improvement |
|---|---|---|---|---|
| 2025 | $2,311 | $69,900 | $0 | $0 |
| 2024 | $2,311 | $64,000 | $0 | $0 |
| 2023 | $2,228 | $55,200 | $0 | $0 |
| 2022 | $4,017 | $48,200 | $0 | $0 |
| 2021 | $3,434 | $45,800 | $0 | $0 |
| 2020 | $2,192 | $41,000 | $0 | $0 |
| 2019 | $2,162 | $34,300 | $0 | $0 |
| 2018 | $985 | $29,100 | $0 | $0 |
| 2017 | $2,299 | $26,900 | $0 | $0 |
| 2016 | $2,223 | $25,500 | $0 | $0 |
| 2015 | $2,113 | $23,100 | $0 | $0 |
| 2013 | $2,110 | $21,900 | $0 | $0 |
| 2012 | $2,009 | $24,800 | $6,100 | $18,700 |
Source: Public Records
Map
Nearby Homes