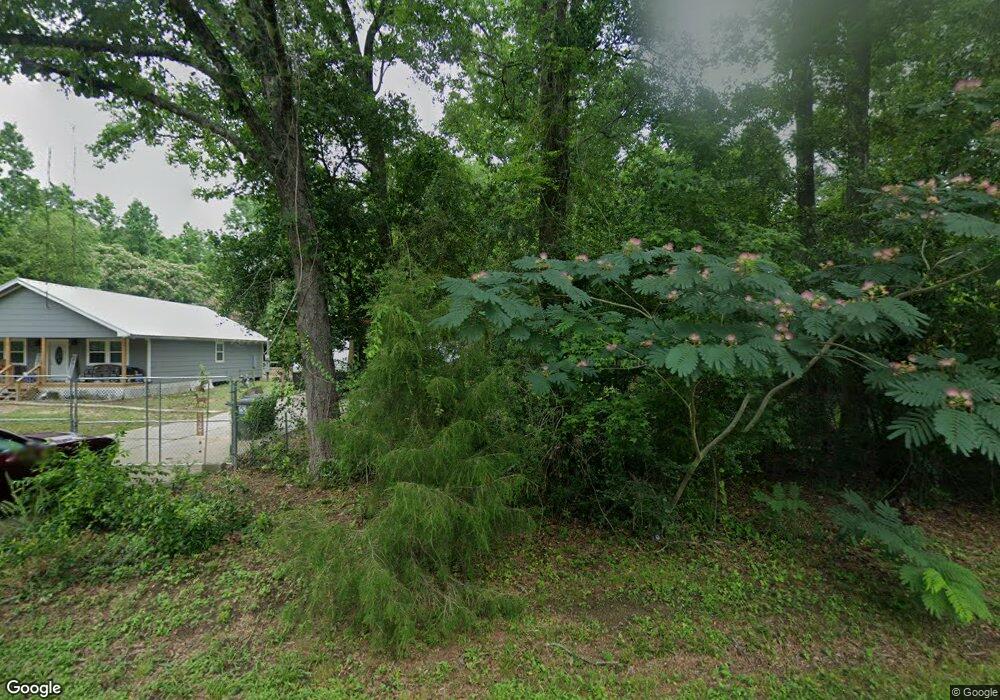
18655 Beeson Rd Conroe, TX 77306
Estimated Value: $195,539 - $364,000
Studio
1
Bath
1,620
Sq Ft
$170/Sq Ft
Est. Value
About This Home
This home is located at 18655 Beeson Rd, Conroe, TX 77306 and is currently estimated at $275,635, approximately $170 per square foot. 18655 Beeson Rd is a home located in Montgomery County with nearby schools including Milam Elementary School, Moorhead Junior High School, and Caney Creek High School.
Ownership History
Date
Name
Owned For
Owner Type
Purchase Details
Closed on
Oct 4, 2016
Sold by
Wheeler Larry and Estate Of Richard Lee Wheeler
Bought by
Laughlin Amanda
Current Estimated Value
Purchase Details
Closed on
Nov 13, 2002
Sold by
Woodrome Patricia Ann
Bought by
Laughlin Amanda
Purchase Details
Closed on
Jan 28, 1997
Sold by
Reynolds J C
Bought by
Laughlin Amanda
Home Financials for this Owner
Home Financials are based on the most recent Mortgage that was taken out on this home.
Original Mortgage
$14,000
Interest Rate
7.73%
Mortgage Type
Seller Take Back
Purchase Details
Closed on
Jan 23, 1997
Sold by
Reynolds Mark D and Reynolds Pam
Bought by
Reynolds John C and Reynolds Barbara
Home Financials for this Owner
Home Financials are based on the most recent Mortgage that was taken out on this home.
Original Mortgage
$14,000
Interest Rate
7.73%
Mortgage Type
Seller Take Back
Create a Home Valuation Report for This Property
The Home Valuation Report is an in-depth analysis detailing your home's value as well as a comparison with similar homes in the area
Purchase History
| Date | Buyer | Sale Price | Title Company |
|---|---|---|---|
| Laughlin Amanda | -- | Attorney | |
| Laughlin Amanda | -- | -- | |
| Laughlin Amanda | -- | -- | |
| Laughlin Amanda | -- | -- | |
| Woodrome Patricia Ann | -- | -- | |
| Reynolds John C | -- | -- |
Source: Public Records
Mortgage History
| Date | Status | Borrower | Loan Amount |
|---|---|---|---|
| Previous Owner | Woodrome Patricia Ann | $14,000 |
Source: Public Records
Tax History
| Year | Tax Paid | Tax Assessment Tax Assessment Total Assessment is a certain percentage of the fair market value that is determined by local assessors to be the total taxable value of land and additions on the property. | Land | Improvement |
|---|---|---|---|---|
| 2025 | $522 | $106,412 | -- | -- |
| 2024 | $484 | $96,738 | $50,000 | $46,738 |
| 2023 | $484 | $92,260 | $50,000 | $42,260 |
| 2022 | $1,602 | $92,260 | $50,000 | $42,260 |
| 2021 | $651 | $35,200 | $35,000 | $200 |
| 2020 | $1,286 | $66,150 | $35,000 | $31,150 |
| 2019 | $650 | $32,270 | $8,700 | $23,570 |
| 2018 | $650 | $32,270 | $8,700 | $23,570 |
| 2017 | $652 | $32,270 | $8,700 | $23,570 |
| 2016 | $461 | $22,790 | $8,700 | $24,880 |
| 2015 | $186 | $20,720 | $6,000 | $24,880 |
| 2014 | $186 | $18,840 | $6,000 | $24,880 |
Source: Public Records
Map
Nearby Homes
- 15104 Forest Ln
- 15091 Fm 1485 Rd
- 15050 Cardinal Trail
- 0 Tommy Smith Rd Unit 37185224
- 0 Tommy Smith Rd Unit 22715308
- 0 Tommy Smith Rd Unit 57108357
- 0 Tommy Smith Rd Unit 22715382
- 15434 Peacock Ln
- 18182 William Ln
- TBD Firetower Rd
- 15930 Fm 1485 Rd
- 17750 Dean Ct
- 17708 Ellzey Ln
- 14272 Firetower Rd
- 14185 Tower Glen Ln
- 14068 Tower Glen Dr
- 14058 Tower Glen Ln
- 15540 Firetower Rd
- 16100 Fm 1485 Rd
- 14848 Old Houston Rd
- 18693 Beeson Rd
- 18674 Beeson Rd
- 0 Beeson
- 18590 Beeson
- 18577 Beeson Rd
- 18699 Woodland Forest Dr
- 18756 Woodland Forest Dr
- 15103 Forest Ln
- 15127 Forest Ln
- 18757 Woodland Forest Dr
- 18640 Woodland Forest Dr
- 18763 Woodland Forest Dr
- TBD Forest Ln
- TBD Tolliver Rd
- 15135 Forest Ln
- 15157 Forest Ln
- 14922 Lucas Ln
- 18604 Tolliver Rd
- 18476 Beeson Rd
- 15237 Forest Ln
Your Personal Tour Guide
Ask me questions while you tour the home.