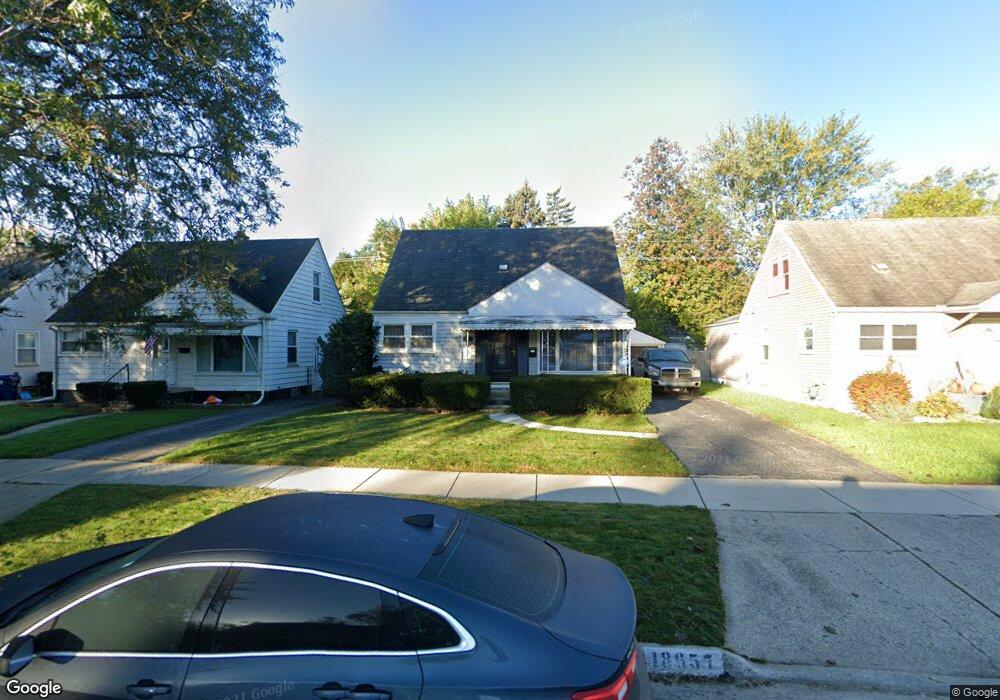
18657 Denby Redford, MI 48240
Estimated Value: $160,556 - $188,000
3
Beds
1
Bath
1,050
Sq Ft
$166/Sq Ft
Est. Value
About This Home
This home is located at 18657 Denby, Redford, MI 48240 and is currently estimated at $174,639, approximately $166 per square foot. 18657 Denby is a home located in Wayne County with nearby schools including Beech Elementary School, Hilbert Middle School, and Redford Union High School.
Ownership History
Date
Name
Owned For
Owner Type
Purchase Details
Closed on
May 12, 2009
Sold by
Sawulski Richard R and The Richard R Sawulski Living
Bought by
Johnson Katanya
Current Estimated Value
Purchase Details
Closed on
Dec 17, 2008
Sold by
Federal Deposit Insurance Corporation
Bought by
Jpmorgan Chase Bank National Association
Purchase Details
Closed on
Oct 31, 2007
Sold by
Berlan Lorrie
Bought by
Washington Mutual Bank Fa
Purchase Details
Closed on
Nov 24, 2004
Sold by
Kammer Sherry Dawn and Larabell Shelly
Bought by
Berlan Lorrie
Create a Home Valuation Report for This Property
The Home Valuation Report is an in-depth analysis detailing your home's value as well as a comparison with similar homes in the area
Home Values in the Area
Average Home Value in this Area
Purchase History
| Date | Buyer | Sale Price | Title Company |
|---|---|---|---|
| Johnson Katanya | $58,900 | Ltic | |
| Jpmorgan Chase Bank National Association | -- | Parks Title | |
| Washington Mutual Bank Fa | $46,000 | None Available | |
| Berlan Lorrie | $119,000 | Multiple |
Source: Public Records
Tax History Compared to Growth
Tax History
| Year | Tax Paid | Tax Assessment Tax Assessment Total Assessment is a certain percentage of the fair market value that is determined by local assessors to be the total taxable value of land and additions on the property. | Land | Improvement |
|---|---|---|---|---|
| 2025 | $720 | $72,400 | $0 | $0 |
| 2024 | $720 | $66,200 | $0 | $0 |
| 2023 | $687 | $57,300 | $0 | $0 |
| 2022 | $1,736 | $50,100 | $0 | $0 |
| 2021 | $1,688 | $47,700 | $0 | $0 |
| 2020 | $1,665 | $43,500 | $0 | $0 |
| 2019 | $1,691 | $36,400 | $0 | $0 |
| 2018 | $619 | $30,500 | $0 | $0 |
| 2017 | $1,801 | $28,300 | $0 | $0 |
| 2016 | $1,512 | $26,800 | $0 | $0 |
| 2015 | $2,225 | $24,300 | $0 | $0 |
| 2013 | $2,220 | $23,100 | $0 | $0 |
| 2012 | $1,539 | $26,100 | $6,900 | $19,200 |
Source: Public Records
Map
Nearby Homes