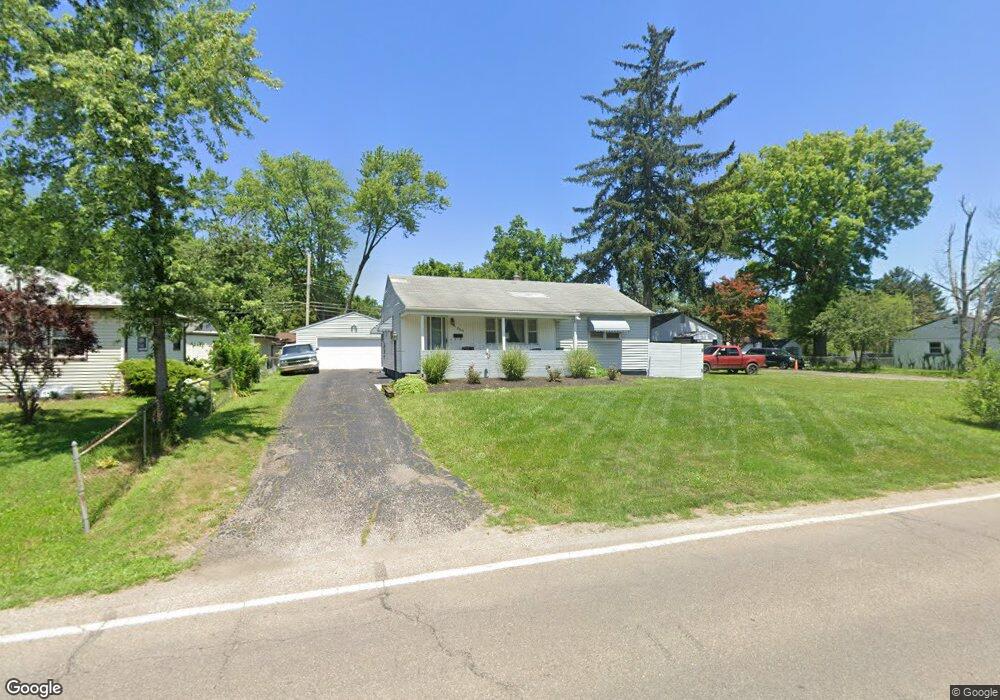
1866 Ferris Rd Columbus, OH 43224
North Linden NeighborhoodEstimated Value: $204,882 - $238,000
3
Beds
2
Baths
988
Sq Ft
$222/Sq Ft
Est. Value
About This Home
This home is located at 1866 Ferris Rd, Columbus, OH 43224 and is currently estimated at $219,221, approximately $221 per square foot. 1866 Ferris Rd is a home located in Franklin County with nearby schools including North Linden Elementary School, Medina Middle School, and Mifflin High School.
Ownership History
Date
Name
Owned For
Owner Type
Purchase Details
Closed on
Aug 30, 2000
Sold by
Evans Mae
Bought by
Hood Karen and Hood Charles
Current Estimated Value
Home Financials for this Owner
Home Financials are based on the most recent Mortgage that was taken out on this home.
Original Mortgage
$85,259
Outstanding Balance
$31,162
Interest Rate
8.14%
Mortgage Type
Purchase Money Mortgage
Estimated Equity
$188,059
Purchase Details
Closed on
Sep 9, 1991
Create a Home Valuation Report for This Property
The Home Valuation Report is an in-depth analysis detailing your home's value as well as a comparison with similar homes in the area
Home Values in the Area
Average Home Value in this Area
Purchase History
| Date | Buyer | Sale Price | Title Company |
|---|---|---|---|
| Hood Karen | $96,000 | Connor Title Co | |
| -- | -- | -- |
Source: Public Records
Mortgage History
| Date | Status | Borrower | Loan Amount |
|---|---|---|---|
| Open | Hood Karen | $85,259 |
Source: Public Records
Tax History Compared to Growth
Tax History
| Year | Tax Paid | Tax Assessment Tax Assessment Total Assessment is a certain percentage of the fair market value that is determined by local assessors to be the total taxable value of land and additions on the property. | Land | Improvement |
|---|---|---|---|---|
| 2024 | $3,271 | $56,640 | $10,330 | $46,310 |
| 2023 | $3,236 | $56,630 | $10,325 | $46,305 |
| 2022 | $2,188 | $30,040 | $7,040 | $23,000 |
| 2021 | $2,191 | $30,040 | $7,040 | $23,000 |
| 2020 | $2,194 | $30,040 | $7,040 | $23,000 |
| 2019 | $1,873 | $23,740 | $5,640 | $18,100 |
| 2018 | $1,876 | $23,740 | $5,640 | $18,100 |
| 2017 | $1,870 | $23,740 | $5,640 | $18,100 |
| 2016 | $2,155 | $24,710 | $4,340 | $20,370 |
| 2015 | $1,880 | $24,710 | $4,340 | $20,370 |
| 2014 | $1,883 | $24,710 | $4,340 | $20,370 |
| 2013 | $1,028 | $27,475 | $4,830 | $22,645 |
Source: Public Records
Map
Nearby Homes
- 1863 Ward Rd
- 1734 Ferris Rd
- 1936 Case Rd
- 1997 Ferris Rd
- 1896 Ormond Ave
- 4111 Walford St
- 2023 Ferris Rd
- 4057 Estates Place
- 4217 Hickman Rd
- 3750 Dresden St
- 4309 Walford St
- 2144 Colfax Ave
- 2194 Ashley Dr
- 1496 E Cooke Rd
- 2220 Sale Rd
- 2219 Sale Rd
- 2015 Melrose Ave
- 1440 E Cooke Rd
- 3749 Ganson Dr
- 2283 Ward Rd