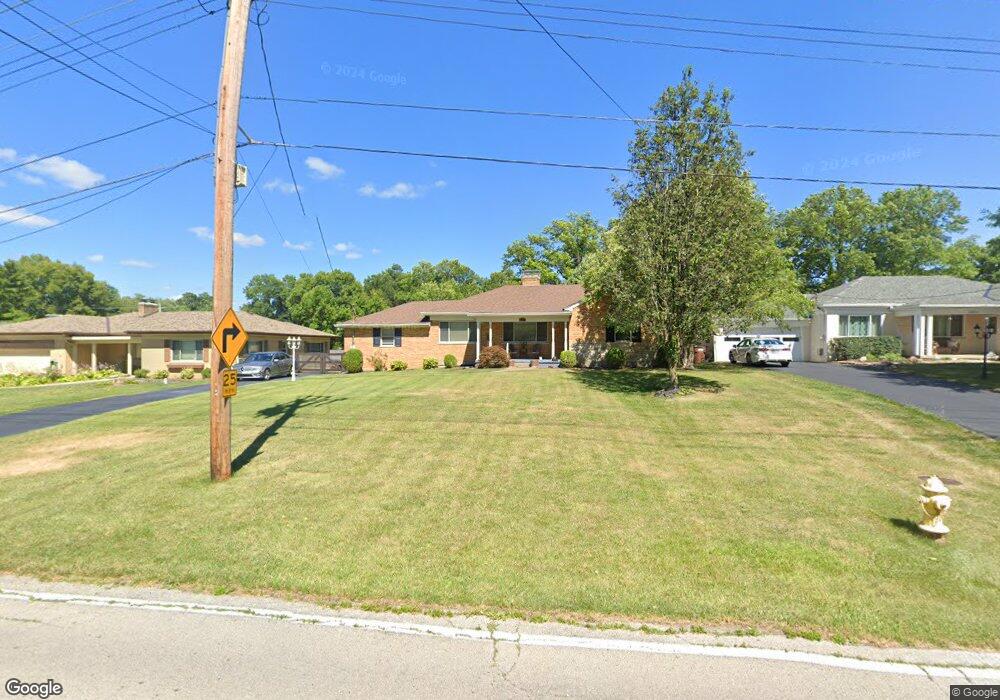
1866 Linneman Rd Cincinnati, OH 45238
Estimated Value: $212,000 - $334,000
3
Beds
2
Baths
1,503
Sq Ft
$182/Sq Ft
Est. Value
About This Home
This home is located at 1866 Linneman Rd, Cincinnati, OH 45238 and is currently estimated at $273,931, approximately $182 per square foot. 1866 Linneman Rd is a home located in Hamilton County with nearby schools including Covedale School, Gilbert A. Dater High School, and Western Hills High School.
Ownership History
Date
Name
Owned For
Owner Type
Purchase Details
Closed on
May 21, 2019
Sold by
Poston William G
Bought by
Poston Daniel T and Poston Julia W
Current Estimated Value
Purchase Details
Closed on
Aug 8, 2007
Sold by
Deutsch Tom and Deutsch Kathy A
Bought by
Poston William G
Home Financials for this Owner
Home Financials are based on the most recent Mortgage that was taken out on this home.
Original Mortgage
$90,000
Interest Rate
6.71%
Mortgage Type
Unknown
Purchase Details
Closed on
Dec 21, 2006
Sold by
Jones Robert G and Jones Ella Ruth
Bought by
Deutsch Tom and Deutsch Kathy A
Home Financials for this Owner
Home Financials are based on the most recent Mortgage that was taken out on this home.
Original Mortgage
$200,000
Interest Rate
6.24%
Mortgage Type
Credit Line Revolving
Purchase Details
Closed on
Oct 12, 2006
Sold by
Jones Robert G
Bought by
Jones Robert G and Jones Georgia L
Create a Home Valuation Report for This Property
The Home Valuation Report is an in-depth analysis detailing your home's value as well as a comparison with similar homes in the area
Home Values in the Area
Average Home Value in this Area
Purchase History
| Date | Buyer | Sale Price | Title Company |
|---|---|---|---|
| Poston Daniel T | $114,000 | None Available | |
| Poston William G | $164,000 | Attorney | |
| Deutsch Tom | $123,500 | Attorney | |
| Jones Robert G | -- | None Available |
Source: Public Records
Mortgage History
| Date | Status | Borrower | Loan Amount |
|---|---|---|---|
| Previous Owner | Poston William G | $90,000 | |
| Previous Owner | Deutsch Tom | $200,000 |
Source: Public Records
Tax History Compared to Growth
Tax History
| Year | Tax Paid | Tax Assessment Tax Assessment Total Assessment is a certain percentage of the fair market value that is determined by local assessors to be the total taxable value of land and additions on the property. | Land | Improvement |
|---|---|---|---|---|
| 2024 | $4,736 | $76,349 | $16,891 | $59,458 |
| 2023 | $4,744 | $76,349 | $16,891 | $59,458 |
| 2022 | $2,876 | $39,900 | $13,517 | $26,383 |
| 2021 | $2,613 | $39,900 | $13,517 | $26,383 |
| 2020 | $2,648 | $39,900 | $13,517 | $26,383 |
| 2019 | $3,348 | $43,995 | $12,068 | $31,927 |
| 2018 | $3,352 | $43,995 | $12,068 | $31,927 |
| 2017 | $2,476 | $43,995 | $12,068 | $31,927 |
| 2016 | $2,641 | $45,756 | $12,415 | $33,341 |
| 2015 | $2,386 | $45,756 | $12,415 | $33,341 |
| 2014 | $2,404 | $45,756 | $12,415 | $33,341 |
| 2013 | $3,058 | $46,218 | $12,541 | $33,677 |
Source: Public Records
Map
Nearby Homes
- 1818 Linneman Rd
- 5420 Fayridge Ct
- 1959 Faywood Dr
- 1833 Leona Dr
- 5318 Sidney Rd
- 5569 Goldcrest Dr
- 1650 Colonial Dr
- 5685 Sidney Rd
- 5435 Lariat Dr
- 3373 Kathy Ln
- 5749 Beech Grove Ln
- 5154 Leona Dr
- 2710 Carroll Ave
- 3659 Allview Cir
- 5252 Relluk Dr
- 5052 Casa Loma Blvd
- 3420 Lumardo Ave
- 5132 Ralph Ave
- 5271 Highview Dr
- 5312 Panther Ct
- 1878 Linneman Rd
- 1854 Linneman Rd
- 1890 Linneman Rd
- 1842 Linneman Rd
- 1867 Churchwood Dr
- 1879 Churchwood Dr
- 1881 Linneman Rd
- 1855 Churchwood Dr
- 1885 Linneman Rd
- 1830 Linneman Rd
- 1843 Linneman Rd
- 1843 Churchwood Dr
- 1831 Churchwood Dr
- 1827 Linneman Rd
- 5475 Sidney Rd
- 1890 Churchwood Dr
- 1868 Churchwood Dr
- 1819 Churchwood Dr
- 1840 Churchwood Dr
- 1806 Linneman Rd