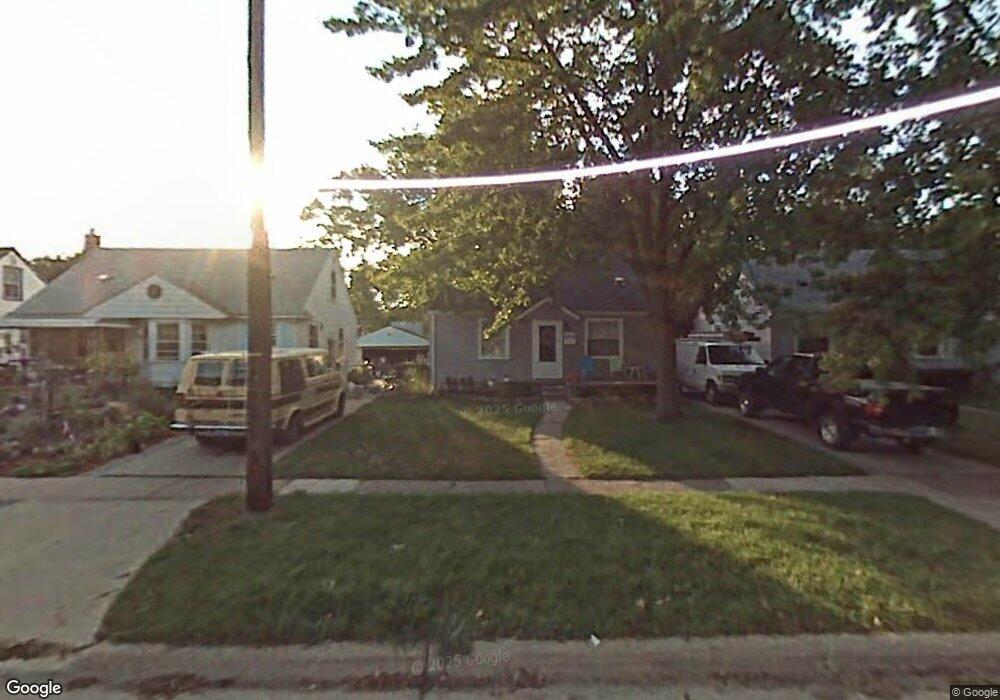
18665 Sumner Redford, MI 48240
Estimated Value: $125,000 - $154,000
Studio
1
Bath
840
Sq Ft
$167/Sq Ft
Est. Value
About This Home
This home is located at 18665 Sumner, Redford, MI 48240 and is currently estimated at $140,202, approximately $166 per square foot. 18665 Sumner is a home located in Wayne County with nearby schools including Beech Elementary School, Hilbert Elementary School, and David Ellis Academy West.
Ownership History
Date
Name
Owned For
Owner Type
Purchase Details
Closed on
Oct 10, 2006
Sold by
Roberts James D
Bought by
Roberts James D
Current Estimated Value
Purchase Details
Closed on
Jun 15, 2005
Sold by
Giller Jason E and Giller Mackenzie K
Bought by
Roberts James D
Purchase Details
Closed on
Dec 23, 2004
Sold by
Giller Jason and Giller Mackenzie K
Bought by
Deutsche Bank National Trust Co
Purchase Details
Closed on
Feb 28, 2001
Sold by
Sterling Bank & Trust
Bought by
Fleet Mtg Corp
Purchase Details
Closed on
Mar 15, 2000
Sold by
Lockhart Carolyn L
Bought by
Sterling Bank & Trust
Create a Home Valuation Report for This Property
The Home Valuation Report is an in-depth analysis detailing your home's value as well as a comparison with similar homes in the area
Home Values in the Area
Average Home Value in this Area
Purchase History
| Date | Buyer | Sale Price | Title Company |
|---|---|---|---|
| Roberts James D | -- | Jefferson Title Llc | |
| Roberts James D | $100,000 | None Available | |
| Deutsche Bank National Trust Co | $98,239 | -- | |
| Fleet Mtg Corp | -- | -- | |
| Sterling Bank & Trust | $89,933 | -- |
Source: Public Records
Tax History
| Year | Tax Paid | Tax Assessment Tax Assessment Total Assessment is a certain percentage of the fair market value that is determined by local assessors to be the total taxable value of land and additions on the property. | Land | Improvement |
|---|---|---|---|---|
| 2025 | $639 | $62,800 | $0 | $0 |
| 2024 | $622 | $57,400 | $0 | $0 |
| 2023 | $593 | $46,900 | $0 | $0 |
| 2022 | $3,085 | $40,400 | $0 | $0 |
| 2021 | $2,851 | $36,700 | $0 | $0 |
| 2020 | $2,801 | $30,300 | $0 | $0 |
| 2019 | $1,803 | $28,300 | $0 | $0 |
| 2018 | $534 | $21,400 | $0 | $0 |
| 2017 | $1,936 | $20,800 | $0 | $0 |
| 2016 | $1,628 | $21,000 | $0 | $0 |
| 2015 | $1,920 | $19,200 | $0 | $0 |
| 2013 | $1,910 | $19,800 | $0 | $0 |
| 2012 | $1,315 | $22,300 | $6,500 | $15,800 |
Source: Public Records
Map
Nearby Homes
- 18809 Sumner
- 18682 Sumner
- 18458 Lennane
- 25608 Pickford
- 00000 Centralia
- 18404 Dalby
- 18671 Five Points St
- 19336 Centralia
- 18680 Five Points St
- 18428 Brady
- 19276 Dalby
- 19357 Centralia
- 17697 Olympia
- 17699 Lennane
- 19355 Brady
- 19369 Wakenden
- 26305 W 7 Mile Rd Unit 101
- 17618 Sumner
- 19207 Grandview St
- 26415 W 7 Mile Rd Unit C218
Your Personal Tour Guide
Ask me questions while you tour the home.