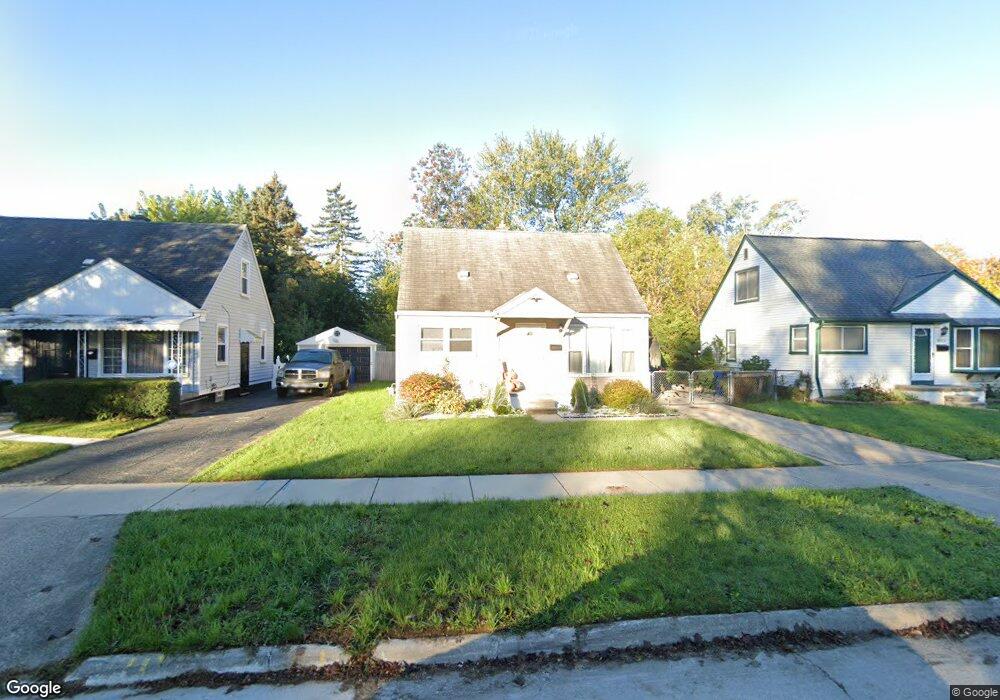
18669 Denby Unit Bldg-Unit Redford, MI 48240
Estimated Value: $197,000 - $278,000
--
Bed
2
Baths
1,519
Sq Ft
$153/Sq Ft
Est. Value
About This Home
This home is located at 18669 Denby Unit Bldg-Unit, Redford, MI 48240 and is currently estimated at $231,844, approximately $152 per square foot. 18669 Denby Unit Bldg-Unit is a home located in Wayne County with nearby schools including Beech Elementary School, Hilbert Middle School, and Redford Union High School.
Ownership History
Date
Name
Owned For
Owner Type
Purchase Details
Closed on
Jul 22, 2019
Sold by
Gonzales Mitchell
Bought by
Allen Aaron and Allen Andreea
Current Estimated Value
Home Financials for this Owner
Home Financials are based on the most recent Mortgage that was taken out on this home.
Original Mortgage
$138,710
Outstanding Balance
$121,522
Interest Rate
3.82%
Mortgage Type
New Conventional
Estimated Equity
$110,322
Purchase Details
Closed on
Nov 29, 2016
Sold by
Zeal Credit Union
Bought by
Gonzales Mitchell
Purchase Details
Closed on
Nov 5, 2015
Sold by
Robbins Michael R and Robbins Erica L
Bought by
Zeal Credit Union
Purchase Details
Closed on
Oct 29, 2015
Sold by
Robbins Michael R and Robbins Erica L
Bought by
Zeal Credit Union
Purchase Details
Closed on
Jul 30, 2002
Sold by
Robbins Ronald S and Robbins Ethel L
Bought by
Robbins Michael R
Create a Home Valuation Report for This Property
The Home Valuation Report is an in-depth analysis detailing your home's value as well as a comparison with similar homes in the area
Home Values in the Area
Average Home Value in this Area
Purchase History
| Date | Buyer | Sale Price | Title Company |
|---|---|---|---|
| Allen Aaron | $143,000 | First American Title Ins Co | |
| Gonzales Mitchell | $45,000 | None Available | |
| Zeal Credit Union | $50,000 | Attorney | |
| Zeal Credit Union | $22,406 | Attorney | |
| Robbins Michael R | $133,000 | -- |
Source: Public Records
Mortgage History
| Date | Status | Borrower | Loan Amount |
|---|---|---|---|
| Open | Allen Aaron | $138,710 |
Source: Public Records
Tax History Compared to Growth
Tax History
| Year | Tax Paid | Tax Assessment Tax Assessment Total Assessment is a certain percentage of the fair market value that is determined by local assessors to be the total taxable value of land and additions on the property. | Land | Improvement |
|---|---|---|---|---|
| 2025 | $2,006 | $114,100 | $0 | $0 |
| 2024 | $2,006 | $104,100 | $0 | $0 |
| 2023 | $1,913 | $89,300 | $0 | $0 |
| 2022 | $4,484 | $77,700 | $0 | $0 |
| 2021 | $4,360 | $73,700 | $0 | $0 |
| 2020 | $4,297 | $66,800 | $0 | $0 |
| 2019 | $2,760 | $55,300 | $0 | $0 |
| 2018 | $1,106 | $42,900 | $0 | $0 |
| 2017 | $3,173 | $39,700 | $0 | $0 |
| 2016 | $2,098 | $37,700 | $0 | $0 |
| 2015 | $3,068 | $33,900 | $0 | $0 |
| 2013 | $3,060 | $32,000 | $0 | $0 |
| 2012 | $2,294 | $36,400 | $7,000 | $29,400 |
Source: Public Records
Map
Nearby Homes