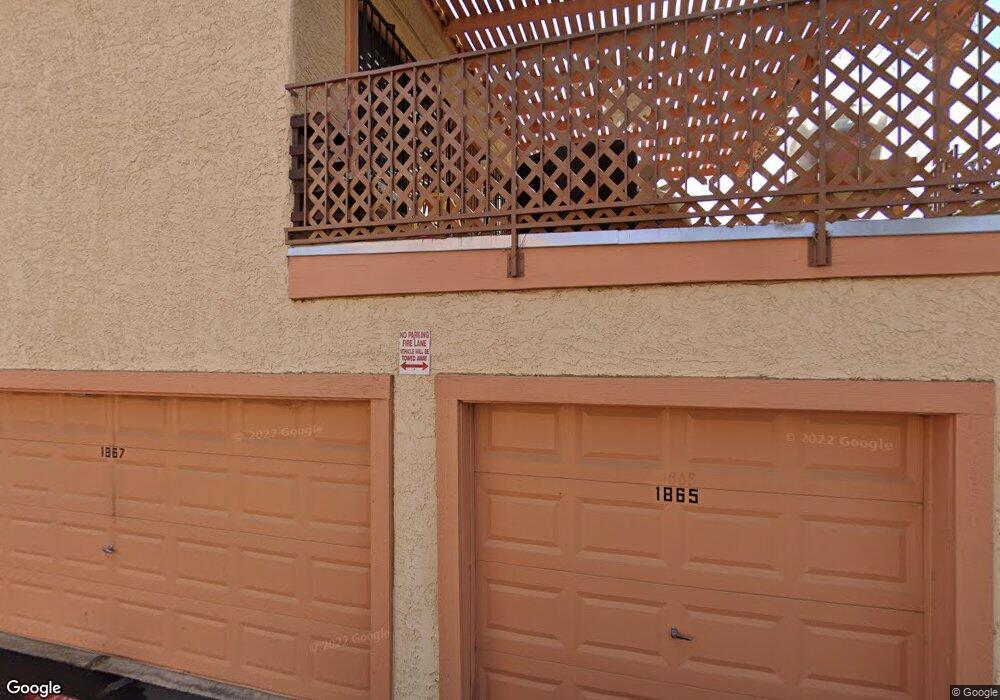
1867 Apricot Ct Unit 68 Henderson, NV 89014
Green Valley North NeighborhoodEstimated Value: $246,000 - $266,000
2
Beds
2
Baths
1,050
Sq Ft
$243/Sq Ft
Est. Value
About This Home
This home is located at 1867 Apricot Ct Unit 68, Henderson, NV 89014 and is currently estimated at $254,973, approximately $242 per square foot. 1867 Apricot Ct Unit 68 is a home located in Clark County with nearby schools including Harriet Treem Elementary School, Jim Thorpe Elementary School, and Francis H Cortney Junior High School.
Ownership History
Date
Name
Owned For
Owner Type
Purchase Details
Closed on
Jan 25, 2007
Sold by
Chura Keith
Bought by
Powell Christopher B
Current Estimated Value
Purchase Details
Closed on
Jan 16, 2007
Sold by
Chura Rebecca
Bought by
Chura Keith
Purchase Details
Closed on
Feb 22, 2005
Sold by
Chura Keith and Chura Rebecca
Bought by
Chura Keith
Home Financials for this Owner
Home Financials are based on the most recent Mortgage that was taken out on this home.
Original Mortgage
$115,000
Interest Rate
5.73%
Mortgage Type
New Conventional
Purchase Details
Closed on
Jun 30, 1998
Sold by
Blake Joyce
Bought by
Chura Keith
Home Financials for this Owner
Home Financials are based on the most recent Mortgage that was taken out on this home.
Original Mortgage
$74,283
Interest Rate
6.92%
Mortgage Type
FHA
Create a Home Valuation Report for This Property
The Home Valuation Report is an in-depth analysis detailing your home's value as well as a comparison with similar homes in the area
Home Values in the Area
Average Home Value in this Area
Purchase History
| Date | Buyer | Sale Price | Title Company |
|---|---|---|---|
| Powell Christopher B | $170,000 | Fidelity National Title | |
| Chura Keith | -- | Fidelity National Title | |
| Chura Keith | -- | Fidelity National Title | |
| Chura Keith | -- | Old Republic Title Company |
Source: Public Records
Mortgage History
| Date | Status | Borrower | Loan Amount |
|---|---|---|---|
| Previous Owner | Chura Keith | $115,000 | |
| Previous Owner | Chura Keith | $74,283 |
Source: Public Records
Tax History Compared to Growth
Tax History
| Year | Tax Paid | Tax Assessment Tax Assessment Total Assessment is a certain percentage of the fair market value that is determined by local assessors to be the total taxable value of land and additions on the property. | Land | Improvement |
|---|---|---|---|---|
| 2025 | $513 | $46,326 | $21,350 | $24,976 |
| 2024 | $498 | $46,326 | $21,350 | $24,976 |
| 2023 | $498 | $47,753 | $24,500 | $23,253 |
| 2022 | $484 | $41,445 | $19,005 | $22,440 |
| 2021 | $470 | $36,229 | $17,500 | $18,729 |
| 2020 | $453 | $37,268 | $17,500 | $19,768 |
| 2019 | $440 | $33,889 | $14,000 | $19,889 |
| 2018 | $427 | $28,005 | $8,750 | $19,255 |
| 2017 | $756 | $26,090 | $6,650 | $19,440 |
| 2016 | $406 | $24,092 | $5,600 | $18,492 |
| 2015 | $404 | $19,855 | $3,850 | $16,005 |
| 2014 | $392 | $13,124 | $3,500 | $9,624 |
Source: Public Records
Map
Nearby Homes
- 1818 Somersby Way
- 1843 Mimosa Ct
- 572 Cervantes Dr
- 1823 Rapier Dr Unit 1823
- 615 Cervantes Dr
- 2695 Dulcinea Dr
- 1979 Cutlass Dr Unit 72
- 1808 Michael Ct
- 1939 Cutlass Dr Unit 92
- 1947 Cutlass Dr Unit 88
- 1723 Comstock Dr
- 844 Flowing Meadow Dr
- 1700 Empire Mine Dr
- 1701 Comstock Dr
- 2416 Greens Ave
- 1947 Sundown Canyon Dr
- 2220 Marlboro Dr
- 505 Meadbury Dr
- 1699 Sonoran Bluff Ave
- 2841 Glendevon Cir
- 1869 Apricot Ct
- 1871 Apricot Ct
- 1866 Apricot Ct
- 1864 Apricot Ct Unit D
- 1870 Apricot Ct Unit A
- 1868 Apricot Ct
- 1868 Apricot Ct Unit B
- 1885 Apricot Ct
- 1887 Apricot Ct
- 1883 Apricot Ct
- 1881 Apricot Ct
- 1842 Plum Ct
- 1848 Plum Ct Unit A
- 1846 Plum Ct
- 1861 Plum Ct
- 1863 Plum Ct Unit D
- 1857 Plum Ct Unit A
- 1878 Apricot Ct Unit D
- 1876 Apricot Ct
- 1874 Apricot Ct