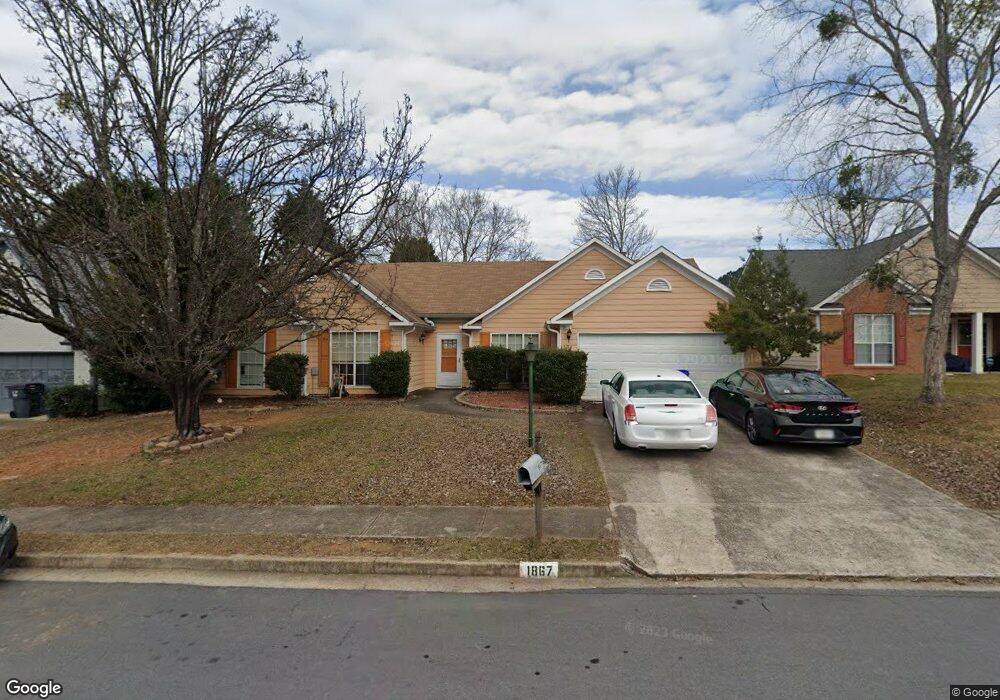
1867 Bitsy Grant Ct Lawrenceville, GA 30044
Gwinnett Place NeighborhoodEstimated Value: $292,000 - $350,000
3
Beds
2
Baths
1,753
Sq Ft
$191/Sq Ft
Est. Value
About This Home
This home is located at 1867 Bitsy Grant Ct, Lawrenceville, GA 30044 and is currently estimated at $334,973, approximately $191 per square foot. 1867 Bitsy Grant Ct is a home located in Gwinnett County with nearby schools including Benefield Elementary School, Richards Middle School, and Discovery High School.
Ownership History
Date
Name
Owned For
Owner Type
Purchase Details
Closed on
Jul 14, 2010
Sold by
Hud & Housing Of Urban Dev
Bought by
Grissett Crystal
Current Estimated Value
Home Financials for this Owner
Home Financials are based on the most recent Mortgage that was taken out on this home.
Original Mortgage
$96,524
Outstanding Balance
$65,818
Interest Rate
5.25%
Mortgage Type
FHA
Estimated Equity
$269,155
Purchase Details
Closed on
Nov 4, 2008
Sold by
Wells Fargo Bk Na
Bought by
Hud-Housing Of Urban Dev
Purchase Details
Closed on
Apr 27, 2000
Sold by
Mulholland Catherine L
Bought by
Gregory Kenneth
Home Financials for this Owner
Home Financials are based on the most recent Mortgage that was taken out on this home.
Original Mortgage
$137,800
Interest Rate
8.23%
Mortgage Type
FHA
Purchase Details
Closed on
Feb 26, 1993
Sold by
Stratford Bldrs Inc
Bought by
Mulholland Catherine L
Home Financials for this Owner
Home Financials are based on the most recent Mortgage that was taken out on this home.
Original Mortgage
$102,845
Interest Rate
7.88%
Mortgage Type
FHA
Create a Home Valuation Report for This Property
The Home Valuation Report is an in-depth analysis detailing your home's value as well as a comparison with similar homes in the area
Home Values in the Area
Average Home Value in this Area
Purchase History
| Date | Buyer | Sale Price | Title Company |
|---|---|---|---|
| Grissett Crystal | $89,500 | -- | |
| Hud-Housing Of Urban Dev | -- | -- | |
| Wells Fargo Bk Na | $146,756 | -- | |
| Gregory Kenneth | $139,000 | -- | |
| Mulholland Catherine L | $104,600 | -- |
Source: Public Records
Mortgage History
| Date | Status | Borrower | Loan Amount |
|---|---|---|---|
| Open | Grissett Crystal | $96,524 | |
| Previous Owner | Gregory Kenneth | $137,800 | |
| Previous Owner | Mulholland Catherine L | $102,845 |
Source: Public Records
Tax History Compared to Growth
Tax History
| Year | Tax Paid | Tax Assessment Tax Assessment Total Assessment is a certain percentage of the fair market value that is determined by local assessors to be the total taxable value of land and additions on the property. | Land | Improvement |
|---|---|---|---|---|
| 2024 | $3,462 | $125,080 | $21,600 | $103,480 |
| 2023 | $3,462 | $122,560 | $28,400 | $94,160 |
| 2022 | $3,030 | $106,080 | $24,000 | $82,080 |
| 2021 | $2,615 | $84,040 | $18,800 | $65,240 |
| 2020 | $2,532 | $79,320 | $16,800 | $62,520 |
| 2019 | $2,363 | $74,480 | $16,800 | $57,680 |
| 2018 | $2,198 | $66,920 | $14,800 | $52,120 |
| 2016 | $1,972 | $55,480 | $12,000 | $43,480 |
| 2015 | $1,569 | $41,800 | $8,800 | $33,000 |
| 2014 | -- | $41,800 | $8,800 | $33,000 |
Source: Public Records
Map
Nearby Homes
- 801 Tulip Poplar Way Unit 2501
- 776 Tulip Poplar Way
- 1980 Champions Pkwy
- 1788 Arbor Gate Dr Unit 1505
- 904 Steffi Ct Unit 3
- 818 Arbor Gate Ln Unit 818
- 803 Arbor Gate Ln Unit 803
- 644 Garden Grove Dr
- 1847 Oak Ridge Ln Unit 4
- 1880 Garbrooke Cove
- 2035 Northland Dr
- 1870 Garbrooke Cove
- 1789 Riverlanding Cir
- 1759 Coleville Oak Ln
- 2014 Poplar Ridge
- 1684 Oak Ridge Way
- 2023 S Oak Dr Unit 5
- 581 Black Creek Dr
- 757 Riverlanding Dr
- 1877 Bitsy Grant Ct
- 1857 Bitsy Grant Ct Unit 1857
- 1857 Bitsy Grant Ct
- 1857 Bitsy Grant Ct
- 1005 Lendl Ln Unit 6
- 0 Bitsy Grant Ct NW Unit 8390851
- 0 Bitsy Grant Ct NW Unit 7256910
- 0 Bitsy Grant Ct NW Unit 7246835
- 0 Bitsy Grant Ct NW Unit 7248638
- 0 Bitsy Grant Ct NW Unit 7314450
- 0 Bitsy Grant Ct NW Unit 7611989
- 0 Bitsy Grant Ct NW
- 1015 Lendl Ln
- 995 Lendl Ln
- 1847 Bitsy Grant Ct
- 1862 Bitsy Grant Ct NW
- 1862 Bitsy Grant Ct Unit 1
- 1872 Bitsy Grant Ct Unit 1
- 1025 Lendl Ln
- 1852 Bitsy Grant Ct Unit I