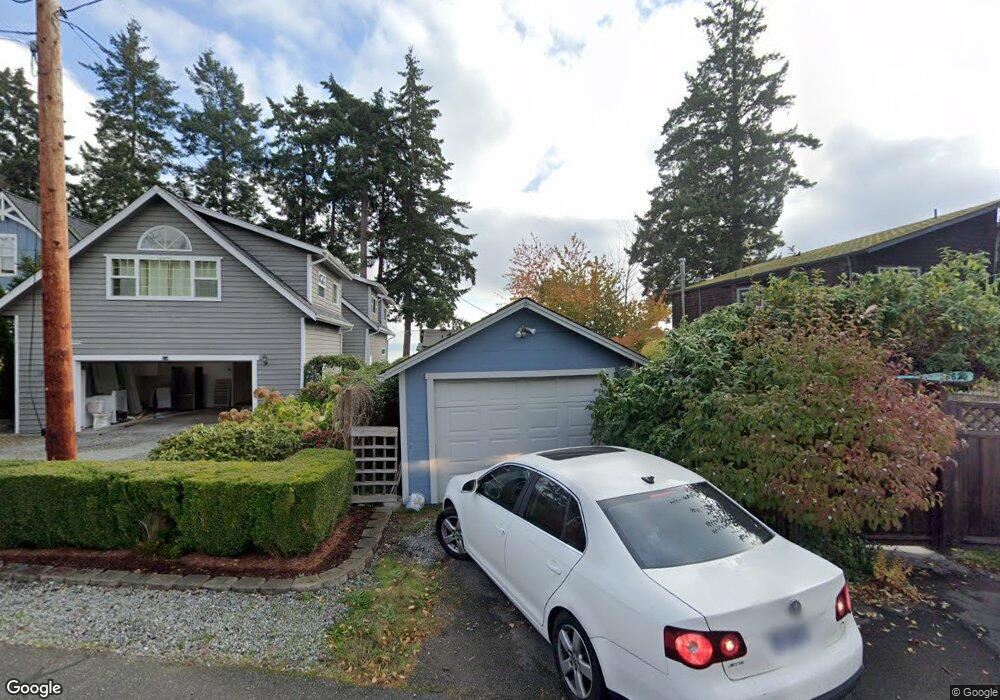
18670 Angeline Ave NE Suquamish, WA 98392
Suquamish NeighborhoodEstimated Value: $594,000 - $746,000
2
Beds
1
Bath
1,051
Sq Ft
$654/Sq Ft
Est. Value
About This Home
This home is located at 18670 Angeline Ave NE, Suquamish, WA 98392 and is currently estimated at $687,480, approximately $654 per square foot. 18670 Angeline Ave NE is a home located in Kitsap County with nearby schools including Suquamish Elementary School, Kingston Middle School, and Kingston High School.
Ownership History
Date
Name
Owned For
Owner Type
Purchase Details
Closed on
Jun 11, 2002
Sold by
Baker June C
Bought by
Labarre Paul D
Current Estimated Value
Home Financials for this Owner
Home Financials are based on the most recent Mortgage that was taken out on this home.
Original Mortgage
$229,500
Outstanding Balance
$96,557
Interest Rate
6.74%
Mortgage Type
VA
Estimated Equity
$590,923
Create a Home Valuation Report for This Property
The Home Valuation Report is an in-depth analysis detailing your home's value as well as a comparison with similar homes in the area
Home Values in the Area
Average Home Value in this Area
Purchase History
| Date | Buyer | Sale Price | Title Company |
|---|---|---|---|
| Labarre Paul D | $225,000 | Transnation Title Insurance |
Source: Public Records
Mortgage History
| Date | Status | Borrower | Loan Amount |
|---|---|---|---|
| Open | Labarre Paul D | $229,500 |
Source: Public Records
Tax History Compared to Growth
Tax History
| Year | Tax Paid | Tax Assessment Tax Assessment Total Assessment is a certain percentage of the fair market value that is determined by local assessors to be the total taxable value of land and additions on the property. | Land | Improvement |
|---|---|---|---|---|
| 2026 | $5,349 | $601,070 | $368,580 | $232,490 |
| 2025 | $5,349 | $601,070 | $368,580 | $232,490 |
| 2024 | $5,165 | $600,020 | $349,210 | $250,810 |
| 2023 | $5,250 | $600,020 | $349,210 | $250,810 |
| 2022 | $4,832 | $524,490 | $303,260 | $221,230 |
| 2021 | $4,632 | $459,140 | $264,200 | $194,940 |
| 2020 | $3,929 | $383,250 | $228,570 | $154,680 |
| 2019 | $3,924 | $383,250 | $228,570 | $154,680 |
| 2018 | $3,662 | $313,140 | $199,150 | $113,990 |
| 2017 | $3,659 | $313,140 | $199,150 | $113,990 |
| 2016 | $3,478 | $272,530 | $181,040 | $91,490 |
| 2015 | $3,331 | $262,650 | $181,040 | $81,610 |
| 2014 | -- | $256,610 | $181,040 | $75,570 |
| 2013 | -- | $275,900 | $197,040 | $78,860 |
Source: Public Records
Map
Nearby Homes
- 19313 Harris Ave NE
- 18689 1st Ave NE
- 18872 Augusta Ave NE
- 18971 Soundview Blvd NE
- 18610 5th Ave NE
- 17711 Division Ave NE
- 0 Augusta Ave NE Unit NWM2412417
- 6712 NE Geneva St
- 17274 Angeline Ave NE
- 6705 NE Prospect St
- 18952 Brockton Ave NE
- 6615 NE Maple St
- 7249 1&2 NE Pebble Beach Dr
- 6508 NE Plum St
- 19777 View Terrace NE
- 17691 Division Ave NE
- 17655 Division Ave NE
- 17880 Purves Ave NE
- 20593 Chief Sealth Dr NE
- 16790 Agate Point Rd NE
- 18640 Angeline Ave NE
- 18698 Angeline Ave NE
- 18632 Angeline Ave NE
- 18712 Angeline Ave NE
- 18669 Angeline Ave NE
- 18616 Angeline Ave NE
- 18729 Angeline Ave NE
- 18639 Angeline Ave NE
- 18754 Angeline Ave NE
- 18608 Angeline Ave NE
- 18742 Harris St NE
- 18753 Angeline Ave NE
- 18684 Harris St NE
- 18684 Harris Ave NE
- 18648 Harris St NE
- 18584 Angeline Ave NE
- 18758 Harris Ave NE
- 18648 Harris Ave NE
- 18767 Angeline Ave NE
- 18646 Harris Ave NE