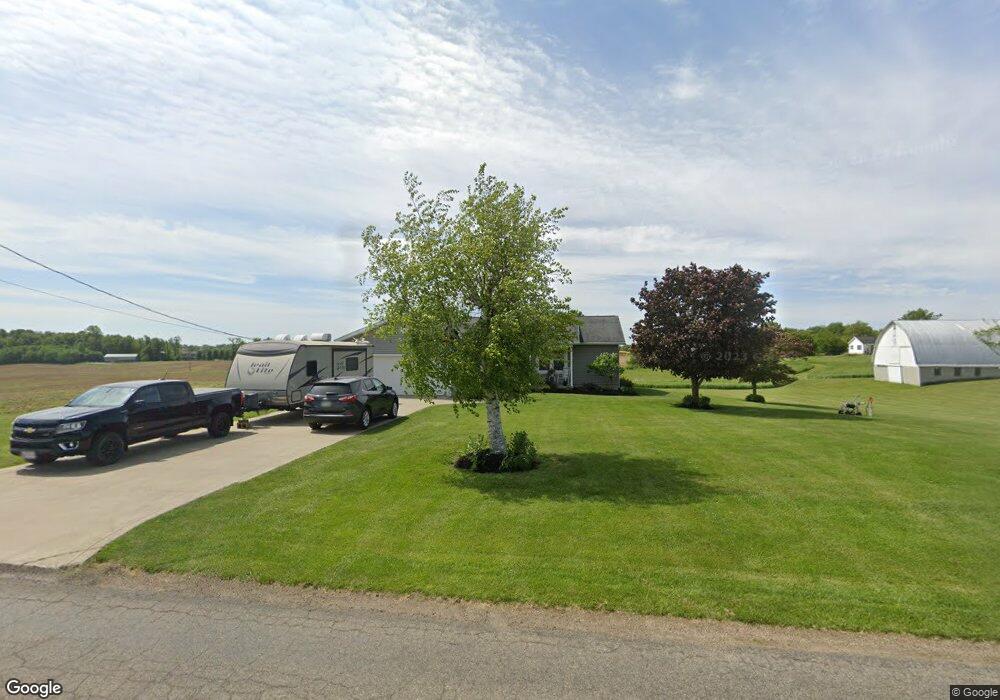
18670 Mishey Rd Butler, OH 44822
Estimated Value: $214,000 - $420,000
3
Beds
2
Baths
1,400
Sq Ft
$218/Sq Ft
Est. Value
About This Home
This home is located at 18670 Mishey Rd, Butler, OH 44822 and is currently estimated at $305,098, approximately $217 per square foot. 18670 Mishey Rd is a home located in Knox County with nearby schools including Clear Fork High School.
Ownership History
Date
Name
Owned For
Owner Type
Purchase Details
Closed on
Mar 22, 2021
Sold by
Sellers Andrea D
Bought by
Chrastina Connie S
Current Estimated Value
Home Financials for this Owner
Home Financials are based on the most recent Mortgage that was taken out on this home.
Original Mortgage
$54,000
Outstanding Balance
$34,256
Interest Rate
2.9%
Mortgage Type
Stand Alone Refi Refinance Of Original Loan
Estimated Equity
$270,842
Purchase Details
Closed on
Jun 27, 2016
Sold by
Chrastina Connie S
Bought by
Connie S Chrastina and Rea D Sellers
Home Financials for this Owner
Home Financials are based on the most recent Mortgage that was taken out on this home.
Interest Rate
3.56%
Purchase Details
Closed on
Nov 23, 1993
Sold by
Chrastina Charlotte E
Bought by
Chrastina Connie S
Create a Home Valuation Report for This Property
The Home Valuation Report is an in-depth analysis detailing your home's value as well as a comparison with similar homes in the area
Home Values in the Area
Average Home Value in this Area
Purchase History
| Date | Buyer | Sale Price | Title Company |
|---|---|---|---|
| Chrastina Connie S | -- | None Available | |
| Connie S Chrastina | -- | -- | |
| Chrastina Connie S | -- | -- |
Source: Public Records
Mortgage History
| Date | Status | Borrower | Loan Amount |
|---|---|---|---|
| Open | Chrastina Connie S | $54,000 | |
| Previous Owner | Chrastina Connie S | $35,000 | |
| Previous Owner | Chrastina Connie S | $20,000 | |
| Previous Owner | Connie S Chrastina | -- | |
| Previous Owner | Chrastina Connie S | $90,000 | |
| Previous Owner | Chrastina Connie S | $10,000 | |
| Previous Owner | Chrastina Connie S | $20,000 |
Source: Public Records
Tax History Compared to Growth
Tax History
| Year | Tax Paid | Tax Assessment Tax Assessment Total Assessment is a certain percentage of the fair market value that is determined by local assessors to be the total taxable value of land and additions on the property. | Land | Improvement |
|---|---|---|---|---|
| 2024 | $2,306 | $67,010 | $12,720 | $54,290 |
| 2023 | $2,306 | $67,010 | $12,720 | $54,290 |
| 2022 | $2,108 | $51,540 | $9,780 | $41,760 |
| 2021 | $2,108 | $51,540 | $9,780 | $41,760 |
| 2020 | $2,075 | $51,540 | $9,780 | $41,760 |
| 2019 | $1,851 | $43,960 | $9,460 | $34,500 |
| 2018 | $1,851 | $43,960 | $9,460 | $34,500 |
| 2017 | $1,806 | $43,960 | $9,460 | $34,500 |
| 2016 | $1,639 | $40,710 | $8,760 | $31,950 |
| 2015 | $1,638 | $40,710 | $8,760 | $31,950 |
| 2014 | $1,637 | $40,710 | $8,760 | $31,950 |
| 2013 | $1,745 | $41,110 | $8,980 | $32,130 |
Source: Public Records
Map
Nearby Homes
- 21625 N Liberty Rd
- 85 E Lakeview Dr
- 0 Divelbiss Rd
- 3898 Ohio 97
- 128 College St
- 224 Blue Bird Dr
- 14345 Spohn Rd
- 0 Mishey Rd
- 4169 State Route 97
- 5449 Hagerman Rd
- 15745 Lower Fredericktown Amity Rd
- 15770 Pleasant View Rd
- 0 N Liberty Rd
- 1260 Ohio 97 Unit 115
- 1259 State Route 97 E
- 1169 State Route 97 E
- 2070 Riggle Rd
- 783 Crestrose Dr
- 17970 Scott Rd
- 11936 Yankee St
- 21032 N Liberty Rd
- 20972 N Liberty Rd
- 20972 N Liberty Rd
- 20972 N Liberty Rd
- 21040 N Liberty Rd
- 0 N Liberty Rd Unit 2012019
- 0 N Liberty Rd Unit 2012034
- 0 N Liberty Rd Unit 2012022
- 0 N Liberty Rd Unit 2012032
- 0 N Liberty Rd Unit 2 2005507
- 0 N Liberty Rd Unit 3 9928147
- 0 N Liberty Rd Unit 9928148
- 0 N Liberty Rd Unit 9927755
- 0 N Liberty Rd Unit 1 9927752
- 0 N Liberty Rd Unit 7 9725197
- 21050 N Liberty Rd
- 18501 Mishey Rd
- 20975 N Liberty Rd
- 20975 N Liberty Rd
- 20975 N Liberty Rd