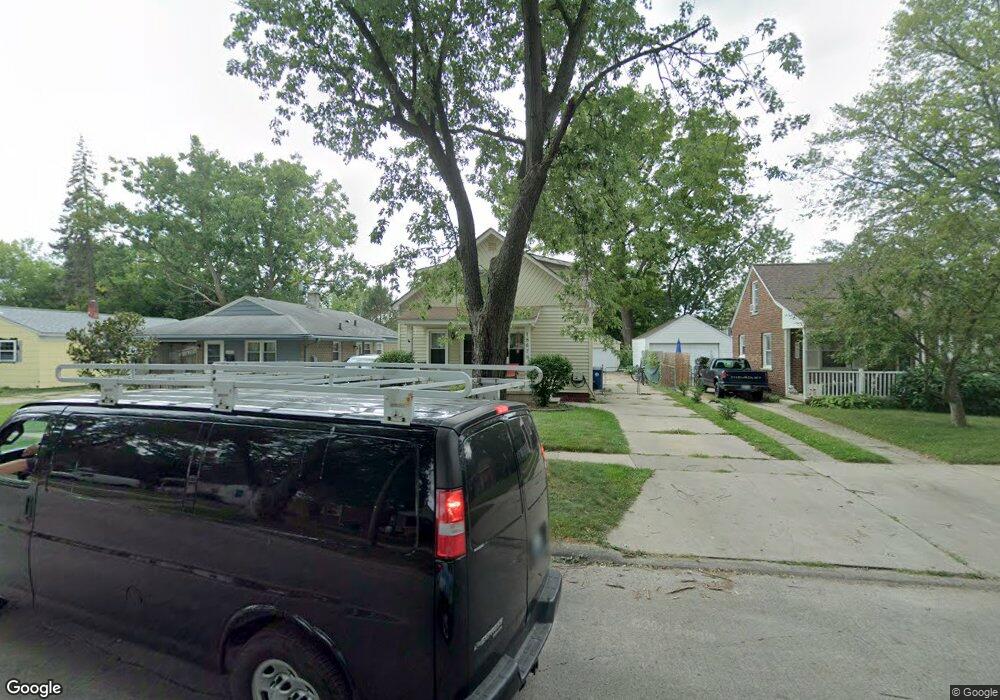
18679 Wakenden Redford, MI 48240
Estimated Value: $170,000 - $217,000
--
Bed
1
Bath
1,260
Sq Ft
$148/Sq Ft
Est. Value
About This Home
This home is located at 18679 Wakenden, Redford, MI 48240 and is currently estimated at $186,158, approximately $147 per square foot. 18679 Wakenden is a home located in Wayne County with nearby schools including Beech Elementary School, Hilbert Middle School, and Redford Union High School.
Ownership History
Date
Name
Owned For
Owner Type
Purchase Details
Closed on
Jan 22, 2024
Sold by
Swift Invesment Group Lic
Bought by
Tyner Kyera A
Current Estimated Value
Home Financials for this Owner
Home Financials are based on the most recent Mortgage that was taken out on this home.
Original Mortgage
$10,000
Outstanding Balance
$9,900
Interest Rate
9.5%
Estimated Equity
$176,258
Purchase Details
Closed on
Aug 24, 2023
Sold by
Borth Thomas H and Borth Melissa A
Bought by
Swift Investment Group Llc
Purchase Details
Closed on
Oct 20, 1994
Sold by
Jodie C Brooks
Bought by
Borth Thomas H and Borth Melissa A
Home Financials for this Owner
Home Financials are based on the most recent Mortgage that was taken out on this home.
Original Mortgage
$47,900
Interest Rate
8.68%
Mortgage Type
New Conventional
Create a Home Valuation Report for This Property
The Home Valuation Report is an in-depth analysis detailing your home's value as well as a comparison with similar homes in the area
Home Values in the Area
Average Home Value in this Area
Purchase History
| Date | Buyer | Sale Price | Title Company |
|---|---|---|---|
| Tyner Kyera A | $175,000 | None Listed On Document | |
| Tyner Kyera A | $175,000 | None Listed On Document | |
| Swift Investment Group Llc | $65,000 | None Listed On Document | |
| Swift Investment Group Llc | $65,000 | None Listed On Document | |
| Borth Thomas H | $59,900 | -- |
Source: Public Records
Mortgage History
| Date | Status | Borrower | Loan Amount |
|---|---|---|---|
| Open | Tyner Kyera A | $10,000 | |
| Open | Tyner Kyera A | $171,830 | |
| Closed | Tyner Kyera A | $171,830 | |
| Previous Owner | Borth Thomas H | $47,900 |
Source: Public Records
Tax History Compared to Growth
Tax History
| Year | Tax Paid | Tax Assessment Tax Assessment Total Assessment is a certain percentage of the fair market value that is determined by local assessors to be the total taxable value of land and additions on the property. | Land | Improvement |
|---|---|---|---|---|
| 2025 | $1,818 | $76,500 | $0 | $0 |
| 2024 | $1,818 | $69,900 | $0 | $0 |
| 2023 | $1,172 | $56,700 | $0 | $0 |
| 2022 | $2,828 | $48,800 | $0 | $0 |
| 2021 | $1,701 | $44,100 | $0 | $0 |
| 2020 | $3,416 | $36,100 | $0 | $0 |
| 2019 | $1,889 | $33,600 | $0 | $0 |
| 2018 | $625 | $25,000 | $0 | $0 |
| 2017 | $1,661 | $24,300 | $0 | $0 |
| 2016 | $1,444 | $24,800 | $0 | $0 |
| 2015 | $2,245 | $22,500 | $0 | $0 |
| 2013 | $2,230 | $23,200 | $0 | $0 |
| 2012 | $1,424 | $26,300 | $6,200 | $20,100 |
Source: Public Records
Map
Nearby Homes