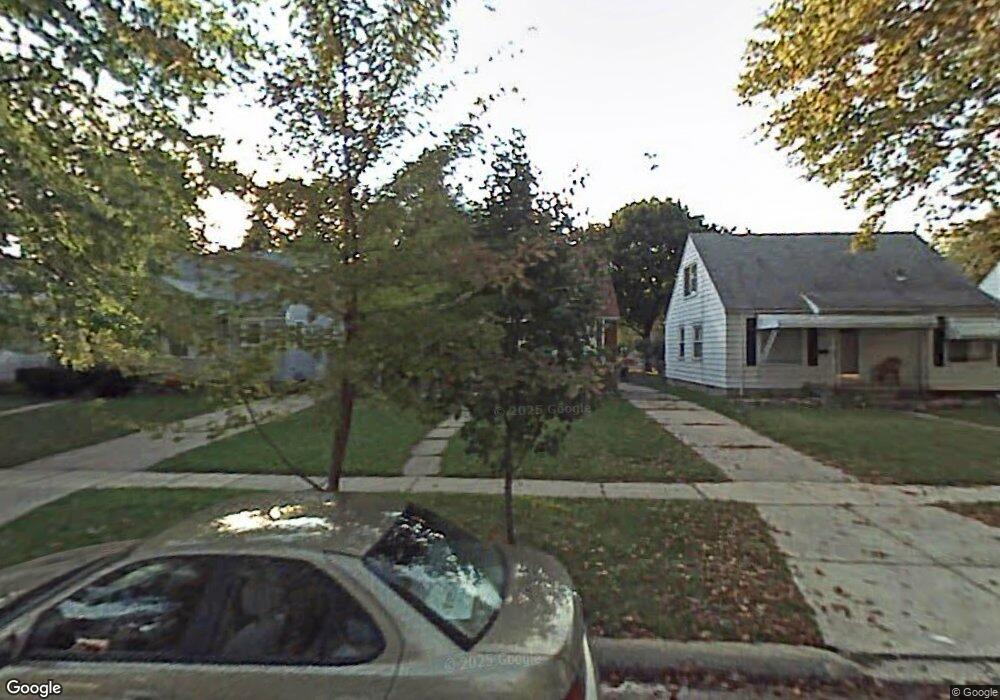
18685 Sumner Unit Bldg-Unit Redford, MI 48240
Estimated Value: $123,000 - $179,000
3
Beds
1
Bath
956
Sq Ft
$154/Sq Ft
Est. Value
About This Home
This home is located at 18685 Sumner Unit Bldg-Unit, Redford, MI 48240 and is currently estimated at $147,681, approximately $154 per square foot. 18685 Sumner Unit Bldg-Unit is a home located in Wayne County with nearby schools including Beech Elementary School, Hilbert Elementary School, and David Ellis Academy West.
Ownership History
Date
Name
Owned For
Owner Type
Purchase Details
Closed on
Apr 10, 2024
Sold by
York Valerie
Bought by
York Valerie A and Valerie A York Trust
Current Estimated Value
Purchase Details
Closed on
Jan 23, 2018
Sold by
Five Star Asset Management Llc
Bought by
York Valerie
Purchase Details
Closed on
May 11, 2017
Sold by
Bruce John E and Bruce Lisa A
Bought by
Five Star Asset Management Llc
Purchase Details
Closed on
Mar 10, 2004
Sold by
Megesi Steven J and Megesi Ronald J
Bought by
Bruce John E
Purchase Details
Closed on
Sep 8, 2000
Sold by
Darcangelo Bonnie J
Bought by
Megesi Steven J
Create a Home Valuation Report for This Property
The Home Valuation Report is an in-depth analysis detailing your home's value as well as a comparison with similar homes in the area
Home Values in the Area
Average Home Value in this Area
Purchase History
| Date | Buyer | Sale Price | Title Company |
|---|---|---|---|
| York Valerie A | -- | None Listed On Document | |
| Valerie A York Trust | -- | None Listed On Document | |
| York Valerie | $56,500 | Ata National Title Group | |
| Five Star Asset Management Llc | $37,980 | None Available | |
| Bruce John E | $114,000 | Multiple | |
| Megesi Steven J | $85,000 | -- |
Source: Public Records
Tax History
| Year | Tax Paid | Tax Assessment Tax Assessment Total Assessment is a certain percentage of the fair market value that is determined by local assessors to be the total taxable value of land and additions on the property. | Land | Improvement |
|---|---|---|---|---|
| 2025 | $1,733 | $73,800 | $0 | $0 |
| 2024 | $1,689 | $67,400 | $0 | $0 |
| 2023 | $1,628 | $54,800 | $0 | $0 |
| 2022 | $3,750 | $47,100 | $0 | $0 |
| 2021 | $3,701 | $42,600 | $0 | $0 |
| 2020 | $3,034 | $35,400 | $0 | $0 |
| 2019 | $2,808 | $33,000 | $0 | $0 |
| 2018 | $998 | $23,800 | $0 | $0 |
| 2017 | $1,779 | $23,100 | $0 | $0 |
| 2016 | $1,696 | $23,500 | $0 | $0 |
| 2015 | $2,140 | $21,400 | $0 | $0 |
| 2013 | $2,120 | $22,100 | $0 | $0 |
| 2012 | $1,485 | $25,000 | $6,300 | $18,700 |
Source: Public Records
Map
Nearby Homes
- 18809 Sumner
- 18682 Sumner
- 18458 Lennane
- 25608 Pickford
- 00000 Centralia
- 18404 Dalby
- 18671 Five Points St
- 19336 Centralia
- 18680 Five Points St
- 18428 Brady
- 19276 Dalby
- 19357 Centralia
- 17697 Olympia
- 17699 Lennane
- 19355 Brady
- 19369 Wakenden
- 26305 W 7 Mile Rd Unit 101
- 17618 Sumner
- 19207 Grandview St
- 26415 W 7 Mile Rd Unit C218
Your Personal Tour Guide
Ask me questions while you tour the home.