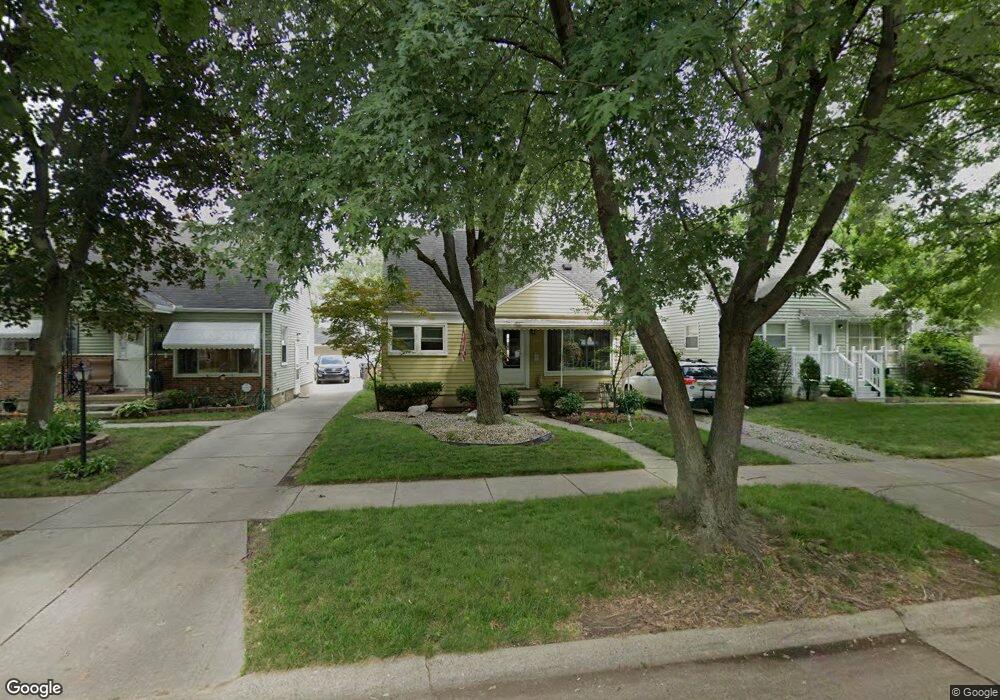
18686 Negaunee Redford, MI 48240
Estimated Value: $131,888 - $194,000
--
Bed
1
Bath
892
Sq Ft
$178/Sq Ft
Est. Value
About This Home
This home is located at 18686 Negaunee, Redford, MI 48240 and is currently estimated at $159,222, approximately $178 per square foot. 18686 Negaunee is a home located in Wayne County with nearby schools including Beech Elementary School, Hilbert Middle School, and Redford Union High School.
Ownership History
Date
Name
Owned For
Owner Type
Purchase Details
Closed on
Dec 29, 2011
Sold by
Alderton Rory Stewart
Bought by
Alderton Barbara Irene
Current Estimated Value
Purchase Details
Closed on
Apr 14, 2005
Sold by
Zelazny Norbert R and Zelazny Irene
Bought by
Alderton Rory S
Home Financials for this Owner
Home Financials are based on the most recent Mortgage that was taken out on this home.
Original Mortgage
$102,000
Outstanding Balance
$74,477
Interest Rate
5.25%
Mortgage Type
Fannie Mae Freddie Mac
Estimated Equity
$84,745
Create a Home Valuation Report for This Property
The Home Valuation Report is an in-depth analysis detailing your home's value as well as a comparison with similar homes in the area
Home Values in the Area
Average Home Value in this Area
Purchase History
| Date | Buyer | Sale Price | Title Company |
|---|---|---|---|
| Alderton Barbara Irene | -- | None Available | |
| Alderton Rory S | -- | First Michigan Title Inc |
Source: Public Records
Mortgage History
| Date | Status | Borrower | Loan Amount |
|---|---|---|---|
| Open | Alderton Rory S | $102,000 |
Source: Public Records
Tax History Compared to Growth
Tax History
| Year | Tax Paid | Tax Assessment Tax Assessment Total Assessment is a certain percentage of the fair market value that is determined by local assessors to be the total taxable value of land and additions on the property. | Land | Improvement |
|---|---|---|---|---|
| 2025 | $705 | $66,300 | $0 | $0 |
| 2024 | $705 | $60,700 | $0 | $0 |
| 2023 | $673 | $52,500 | $0 | $0 |
| 2022 | $1,652 | $47,900 | $0 | $0 |
| 2021 | $1,606 | $45,500 | $0 | $0 |
| 2020 | $1,585 | $40,800 | $0 | $0 |
| 2019 | $1,551 | $34,200 | $0 | $0 |
| 2018 | $585 | $28,900 | $0 | $0 |
| 2017 | $1,511 | $26,800 | $0 | $0 |
| 2016 | $1,328 | $25,400 | $0 | $0 |
| 2015 | $2,103 | $23,000 | $0 | $0 |
| 2013 | $2,100 | $21,900 | $0 | $0 |
| 2012 | $1,466 | $24,700 | $6,100 | $18,600 |
Source: Public Records
Map
Nearby Homes