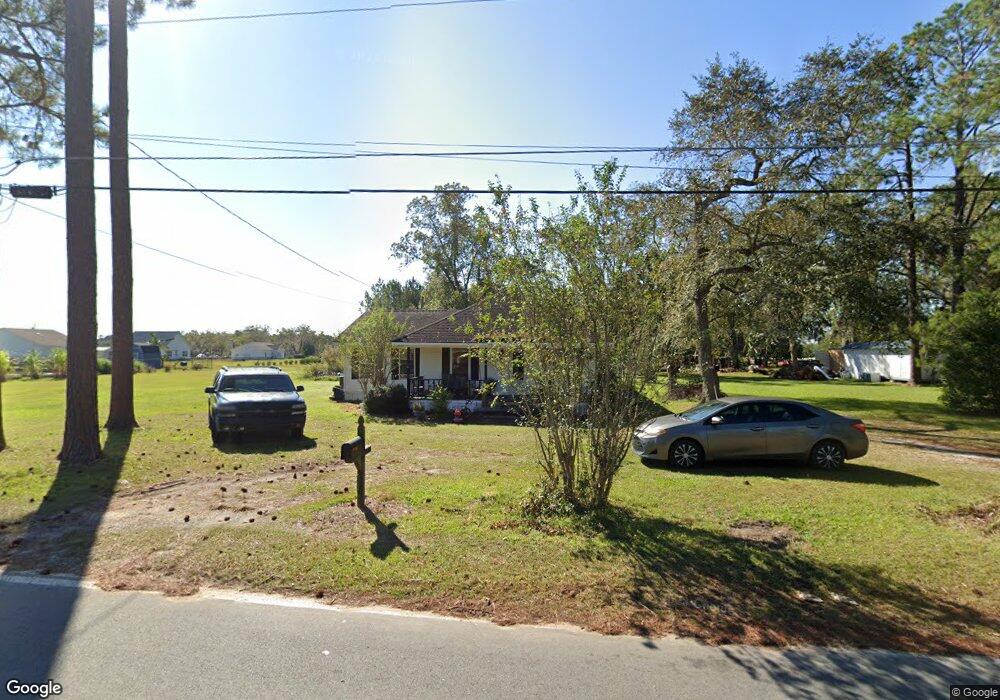
1869 Blalock Ave Waycross, GA 31503
Estimated Value: $138,000 - $163,000
3
Beds
1
Bath
1,430
Sq Ft
$107/Sq Ft
Est. Value
About This Home
This home is located at 1869 Blalock Ave, Waycross, GA 31503 and is currently estimated at $152,297, approximately $106 per square foot. 1869 Blalock Ave is a home located in Ware County with nearby schools including Wacona Elementary School, Ware County Middle School, and Ware County High School.
Ownership History
Date
Name
Owned For
Owner Type
Purchase Details
Closed on
Aug 30, 2019
Sold by
Abell Jason Robert
Bought by
Abell Jessica Chastain
Current Estimated Value
Purchase Details
Closed on
Mar 17, 2017
Sold by
Knight Roy
Bought by
Chastain Abell Jessica and Abell Jason Robert
Home Financials for this Owner
Home Financials are based on the most recent Mortgage that was taken out on this home.
Original Mortgage
$27,826
Interest Rate
4.15%
Mortgage Type
New Conventional
Purchase Details
Closed on
Feb 9, 2012
Sold by
Kepp Kelly D and Dowling Kelly
Bought by
Knight Roy and Knight Milva
Purchase Details
Closed on
Aug 8, 1995
Bought by
Dowling Kelly
Purchase Details
Closed on
Feb 5, 1991
Bought by
Howell James E
Purchase Details
Closed on
Feb 12, 1986
Create a Home Valuation Report for This Property
The Home Valuation Report is an in-depth analysis detailing your home's value as well as a comparison with similar homes in the area
Home Values in the Area
Average Home Value in this Area
Purchase History
| Date | Buyer | Sale Price | Title Company |
|---|---|---|---|
| Abell Jessica Chastain | -- | -- | |
| Chastain Abell Jessica | $27,826 | -- | |
| Knight Roy | $49,500 | -- | |
| Dowling Kelly | $28,000 | -- | |
| Howell James E | -- | -- | |
| -- | $15,000 | -- |
Source: Public Records
Mortgage History
| Date | Status | Borrower | Loan Amount |
|---|---|---|---|
| Previous Owner | Chastain Abell Jessica | $27,826 |
Source: Public Records
Tax History Compared to Growth
Tax History
| Year | Tax Paid | Tax Assessment Tax Assessment Total Assessment is a certain percentage of the fair market value that is determined by local assessors to be the total taxable value of land and additions on the property. | Land | Improvement |
|---|---|---|---|---|
| 2024 | $753 | $48,300 | $1,202 | $47,098 |
| 2023 | $768 | $35,615 | $4,077 | $31,538 |
| 2022 | $846 | $35,615 | $4,077 | $31,538 |
| 2021 | $932 | $29,705 | $4,077 | $25,628 |
| 2020 | $874 | $27,551 | $4,077 | $23,474 |
| 2019 | $651 | $20,144 | $4,160 | $15,984 |
| 2018 | $363 | $19,528 | $4,160 | $15,368 |
| 2017 | $682 | $20,905 | $4,160 | $16,745 |
| 2016 | $682 | $20,905 | $4,160 | $16,745 |
| 2015 | $688 | $20,904 | $4,160 | $16,745 |
| 2014 | $687 | $20,905 | $4,160 | $16,745 |
| 2013 | -- | $20,904 | $4,160 | $16,744 |
Source: Public Records
Map
Nearby Homes
- 3860 Blalock Ave
- 3648 Tanner Ln
- 3825 Jamestown Rd
- 1621 Meadowood Dr
- 1691 Huckaby Rd
- 123 Winn Clay Dr
- 4167 Jamestown Rd
- 4190 Church Street Extension
- 06 Alton Cir
- 03 Alton Cir
- 02 Alton Cir
- 04 Alton Cir
- 01 Alton Cir
- 2508 Mesa Rd
- Tract 2,3 Stetson Dr
- 2885 Ben St
- 2879 Ben St
- 2869 Ben St
- 221 Sierra Ln
- 0 Ash Dr
- 1889 Blalock Ave
- 3701 Lucile St
- 1851 Blalock Ave
- 3724 Lucile St
- 1853 Blalock Ave
- 3609 Tanner Ln
- 3751 Benny St
- 0 Blalock Ave Unit 21694
- 000 Blalock Ave
- 0000 Blalock Ave
- 3760 Lucile St
- 3779 Benny St
- 3711 Jamestown Rd
- 3724 Benny St
- 3620 Tanner Ln
- 3744 Benny St
- 3804 Lucile St
- 3829 Benny St
- 1837 Blalock Ave
- 1837 Blalock Ave