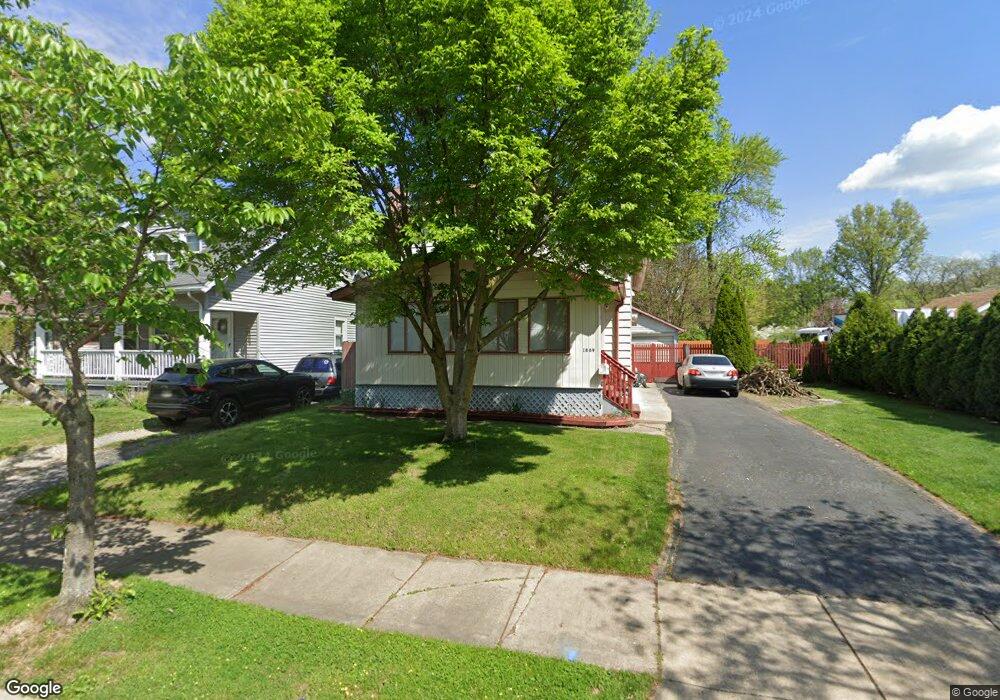
1869 Flint Ave Akron, OH 44305
Goodyear Heights NeighborhoodEstimated Value: $99,848 - $146,000
2
Beds
3
Baths
1,386
Sq Ft
$91/Sq Ft
Est. Value
About This Home
This home is located at 1869 Flint Ave, Akron, OH 44305 and is currently estimated at $126,712, approximately $91 per square foot. 1869 Flint Ave is a home located in Summit County with nearby schools including Seiberling Community Learning Center, Akron Preparatory school, and Middlebury Academy.
Ownership History
Date
Name
Owned For
Owner Type
Purchase Details
Closed on
May 18, 2022
Sold by
Bucur Andrei M
Bought by
Bucur Ioana Cristina
Current Estimated Value
Purchase Details
Closed on
Aug 6, 2021
Sold by
Zsebe Anton and Zsebe Ileana
Bought by
Bucur Andrei M and Bucur Ioana Cristina
Purchase Details
Closed on
Apr 10, 2018
Sold by
Zsebe Anton and Zsebe Heabna
Bought by
Bucur Andrei M and Bucur Ioana Cristina
Home Financials for this Owner
Home Financials are based on the most recent Mortgage that was taken out on this home.
Original Mortgage
$34,500
Interest Rate
4.43%
Mortgage Type
Seller Take Back
Purchase Details
Closed on
Apr 20, 2017
Sold by
Susman Dan G and Susman Ecaterina
Bought by
Zsebe Anton and Zsebe Heana
Purchase Details
Closed on
May 3, 1996
Sold by
Russell Marsha L
Bought by
Zsebe Anton and Zsebe Ileana
Create a Home Valuation Report for This Property
The Home Valuation Report is an in-depth analysis detailing your home's value as well as a comparison with similar homes in the area
Home Values in the Area
Average Home Value in this Area
Purchase History
| Date | Buyer | Sale Price | Title Company |
|---|---|---|---|
| Bucur Ioana Cristina | -- | None Listed On Document | |
| Bucur Andrei M | $35,000 | Kingdom Title | |
| Bucur Andrei M | $35,000 | Kingdom Title | |
| Zsebe Anton | -- | Kingdom Title | |
| Zsebe Anton | $25,000 | -- |
Source: Public Records
Mortgage History
| Date | Status | Borrower | Loan Amount |
|---|---|---|---|
| Previous Owner | Bucur Andrei M | $34,500 |
Source: Public Records
Tax History
| Year | Tax Paid | Tax Assessment Tax Assessment Total Assessment is a certain percentage of the fair market value that is determined by local assessors to be the total taxable value of land and additions on the property. | Land | Improvement |
|---|---|---|---|---|
| 2025 | $1,954 | $35,995 | $8,474 | $27,521 |
| 2024 | $1,954 | $35,995 | $8,474 | $27,521 |
| 2023 | $1,954 | $35,995 | $8,474 | $27,521 |
| 2022 | $1,711 | $24,549 | $5,726 | $18,823 |
| 2021 | $1,757 | $24,549 | $5,726 | $18,823 |
| 2020 | $1,731 | $24,550 | $5,730 | $18,820 |
| 2019 | $1,630 | $20,910 | $5,940 | $14,970 |
| 2018 | $960 | $20,910 | $5,940 | $14,970 |
| 2017 | $974 | $20,910 | $5,940 | $14,970 |
| 2016 | $974 | $20,910 | $5,940 | $14,970 |
| 2015 | $974 | $20,910 | $5,940 | $14,970 |
| 2014 | $966 | $20,910 | $5,940 | $14,970 |
| 2013 | $978 | $21,340 | $5,940 | $15,400 |
Source: Public Records
Map
Nearby Homes
- 1874 Adelaide Blvd
- 204 Morningview Ave
- 1820 Malasia Rd
- 250 Morningview Ave
- 1584 Hampton Rd
- 248 Malacca St
- 1551 Preston Ave
- 20 Verdun Dr
- 291 Malacca St
- 82 Dellenberger Ave
- 295 Goodview Ave
- 1581 Hillside Terrace
- 153 Cutler Pkwy
- 1991-1993 Congo St
- 1578 Pilgrim St
- 1591 Pilgrim St
- 1852 Cramer Ave
- 365 Larkin Ave
- 2258 Mogadore Rd
- 425 Frazier Ave
- 1865 Flint Ave
- 1877 Flint Ave
- 1861 Flint Ave
- 1881 Flint Ave
- 1870 Adelaide Blvd
- 1866 Adelaide Blvd
- 1857 Flint Ave
- 1880 Adelaide Blvd
- 1866 Flint Ave
- 1862 Adelaide Blvd
- 1870 Flint Ave
- 1874 Flint Ave
- 1855 Flint Ave
- 1878 Flint Ave
- 1858 Adelaide Blvd
- 1888 Adelaide Blvd
- 1882 Flint Ave
- 1858 Flint Ave
- 1889 Flint Ave
- 1854 Adelaide Blvd
Your Personal Tour Guide
Ask me questions while you tour the home.