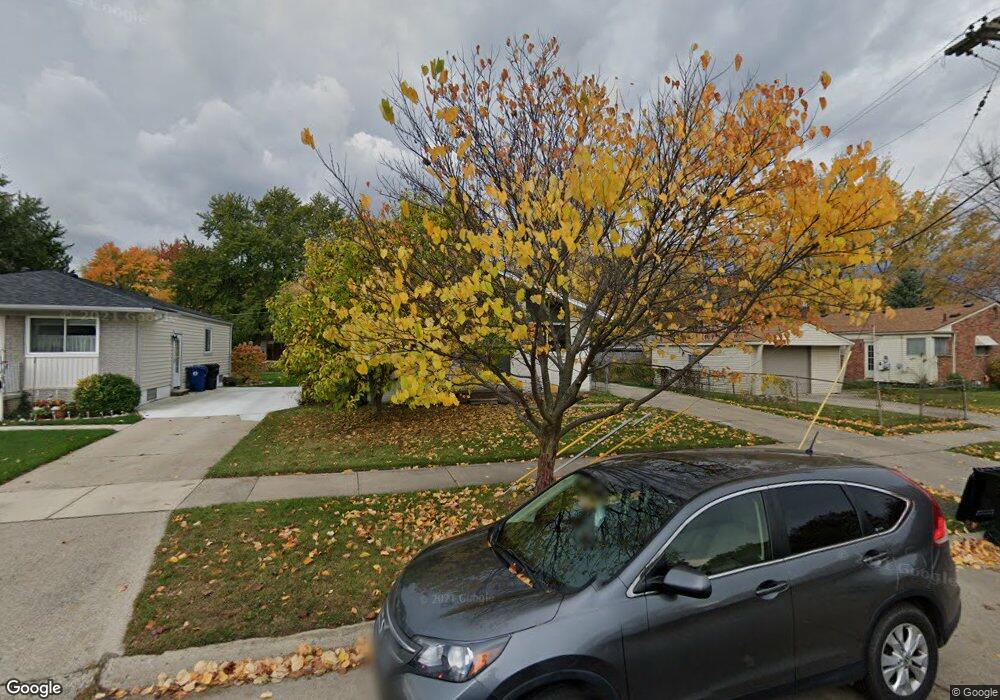
18697 Kinloch Redford, MI 48240
Estimated Value: $185,752 - $210,000
4
Beds
2
Baths
1,141
Sq Ft
$173/Sq Ft
Est. Value
About This Home
This home is located at 18697 Kinloch, Redford, MI 48240 and is currently estimated at $197,938, approximately $173 per square foot. 18697 Kinloch is a home located in Wayne County with nearby schools including Beech Elementary School, Hilbert Elementary School, and Redford Union High School.
Ownership History
Date
Name
Owned For
Owner Type
Purchase Details
Closed on
Apr 22, 2024
Sold by
Ye Xiaogang
Bought by
White Devon
Current Estimated Value
Purchase Details
Closed on
Jul 31, 2015
Sold by
Lagana Tracy A and York Lynn A
Bought by
Dafa Llc
Purchase Details
Closed on
Aug 12, 2013
Sold by
Christe Kimberly and Yorke Lynn A
Bought by
Yorke Lynn A and Lagana Tracy A
Purchase Details
Closed on
Apr 5, 2013
Sold by
Wilbanks James Lee and Wilbanks Francine
Bought by
Christe Kimberly and Yorke Lynn A
Purchase Details
Closed on
Apr 20, 2009
Sold by
Wilbanks James Lee
Bought by
James Lee Wilbanks Revocable Living Trus
Purchase Details
Closed on
Apr 1, 2009
Sold by
Deutsche Bank National Trust Company
Bought by
Wilbanks James Lee
Purchase Details
Closed on
Jan 2, 2008
Sold by
Myers Kathy and Myers Kenneth
Bought by
Deutsche Bank National Trust Co and Ameriquest Mortgage Securities Inc Asset
Purchase Details
Closed on
Dec 13, 1999
Sold by
Myers Kathy
Bought by
Myers Kathleen M
Create a Home Valuation Report for This Property
The Home Valuation Report is an in-depth analysis detailing your home's value as well as a comparison with similar homes in the area
Home Values in the Area
Average Home Value in this Area
Purchase History
| Date | Buyer | Sale Price | Title Company |
|---|---|---|---|
| White Devon | $67,000 | None Listed On Document | |
| Dafa Llc | $50,000 | Vintage Title Agency | |
| Yorke Lynn A | -- | None Available | |
| Christe Kimberly | $34,256 | None Available | |
| James Lee Wilbanks Revocable Living Trus | -- | None Available | |
| Wilbanks James Lee | $14,000 | Attorneys Title Agency Llc | |
| Deutsche Bank National Trust Co | $140,039 | None Available | |
| Myers Kathleen M | -- | -- |
Source: Public Records
Tax History Compared to Growth
Tax History
| Year | Tax Paid | Tax Assessment Tax Assessment Total Assessment is a certain percentage of the fair market value that is determined by local assessors to be the total taxable value of land and additions on the property. | Land | Improvement |
|---|---|---|---|---|
| 2025 | $1,657 | $89,800 | $0 | $0 |
| 2024 | $1,657 | $82,000 | $0 | $0 |
| 2023 | $1,598 | $70,600 | $0 | $0 |
| 2022 | $2,936 | $61,700 | $0 | $0 |
| 2021 | $2,859 | $58,600 | $0 | $0 |
| 2020 | $2,819 | $53,100 | $0 | $0 |
| 2019 | $2,760 | $44,300 | $0 | $0 |
| 2018 | $1,427 | $35,400 | $0 | $0 |
| 2017 | $2,199 | $32,800 | $0 | $0 |
| 2016 | $2,492 | $31,100 | $0 | $0 |
| 2015 | $2,550 | $28,100 | $0 | $0 |
| 2013 | $2,550 | $26,600 | $0 | $0 |
| 2012 | $1,787 | $30,100 | $7,000 | $23,100 |
Source: Public Records
Map
Nearby Homes
- 18691 Kinloch
- 26207 Clarita
- 18683 Kinloch
- 26231 Clarita
- 18742 Woodworth
- 18675 Kinloch
- 18730 Woodworth
- 18692 Kinloch
- 18698 Kinloch
- 18704 Kinloch
- 18686 Kinloch
- 18661 Kinloch
- 18710 Kinloch
- 18724 Woodworth Unit Bldg-Unit
- 18724 Woodworth
- 18678 Kinloch
- 18716 Kinloch
- 18670 Kinloch
- 26208 Clarita
- 26220 Clarita