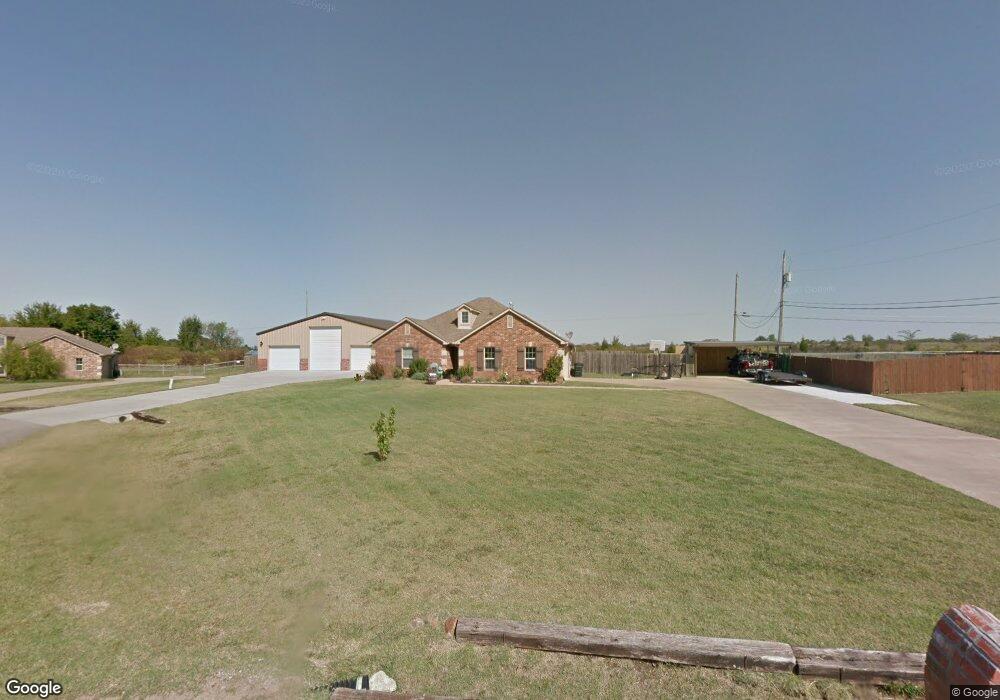
18697 Valley Ave Collinsville, OK 74021
Estimated Value: $289,000 - $328,000
3
Beds
2
Baths
1,854
Sq Ft
$170/Sq Ft
Est. Value
About This Home
This home is located at 18697 Valley Ave, Collinsville, OK 74021 and is currently estimated at $314,838, approximately $169 per square foot. 18697 Valley Ave is a home located in Rogers County with nearby schools including Northeast Elementary School, Owasso 6th Grade Center, and Owasso 8th Grade Center.
Ownership History
Date
Name
Owned For
Owner Type
Purchase Details
Closed on
Oct 25, 2023
Sold by
Filby Carol Robinson
Bought by
Filby Gary R
Current Estimated Value
Purchase Details
Closed on
Oct 16, 2008
Sold by
Webster Jennifer M
Bought by
Filby Gary R and Filby Carol Robinson
Home Financials for this Owner
Home Financials are based on the most recent Mortgage that was taken out on this home.
Original Mortgage
$119,000
Interest Rate
5.83%
Mortgage Type
New Conventional
Purchase Details
Closed on
Mar 5, 2007
Sold by
Williams Bradley A and Williams Keline L
Bought by
Webster Jennifer M
Home Financials for this Owner
Home Financials are based on the most recent Mortgage that was taken out on this home.
Original Mortgage
$16,300
Interest Rate
6.32%
Mortgage Type
Unknown
Purchase Details
Closed on
Sep 21, 2004
Sold by
Xite Homes Llc
Purchase Details
Closed on
Feb 24, 2004
Sold by
Cherub Investments Inc
Create a Home Valuation Report for This Property
The Home Valuation Report is an in-depth analysis detailing your home's value as well as a comparison with similar homes in the area
Home Values in the Area
Average Home Value in this Area
Purchase History
| Date | Buyer | Sale Price | Title Company |
|---|---|---|---|
| Filby Gary R | $177,500 | None Listed On Document | |
| Filby Gary R | $182,000 | Guaranty Abstract Company | |
| Webster Jennifer M | $163,000 | Heartland Title And Closing | |
| -- | $147,500 | -- | |
| -- | $36,000 | -- |
Source: Public Records
Mortgage History
| Date | Status | Borrower | Loan Amount |
|---|---|---|---|
| Previous Owner | Filby Gary R | $119,000 | |
| Previous Owner | Webster Jennifer M | $16,300 | |
| Previous Owner | Webster Jennifer M | $130,400 |
Source: Public Records
Tax History Compared to Growth
Tax History
| Year | Tax Paid | Tax Assessment Tax Assessment Total Assessment is a certain percentage of the fair market value that is determined by local assessors to be the total taxable value of land and additions on the property. | Land | Improvement |
|---|---|---|---|---|
| 2025 | $273 | $25,776 | $3,494 | $22,282 |
| 2024 | $2,665 | $25,025 | $3,392 | $21,633 |
| 2023 | $2,665 | $24,296 | $3,178 | $21,118 |
| 2022 | $2,550 | $23,589 | $3,152 | $20,437 |
| 2021 | $2,446 | $23,588 | $3,285 | $20,303 |
| 2020 | $2,369 | $22,902 | $3,211 | $19,691 |
| 2019 | $2,298 | $21,587 | $2,750 | $18,837 |
| 2018 | $2,284 | $22,144 | $2,750 | $19,394 |
| 2017 | $2,287 | $21,972 | $2,750 | $19,222 |
| 2016 | $2,234 | $21,464 | $2,750 | $18,714 |
| 2015 | $2,182 | $20,839 | $2,750 | $18,089 |
| 2014 | $2,145 | $20,365 | $2,750 | $17,615 |
Source: Public Records
Map
Nearby Homes
- 12047 N 193rd East Ave
- 12225 N 194th East Ave
- 11610 N 190th East Ave
- 0 Hobbs Creek Dr Unit 2541616
- 12875 N 193rd East Ave
- 13247 Hobbs Creek Dr
- 12885 N 193rd East Ave
- 4608 E 472 Rd
- 5 Hobbs Creek Trail
- 16893 E 116th St N
- 17542 E 112th St N
- 16550 E 120th St N
- 11417 N 168th East Ave
- 12537 N 165th East Ave
- 4728 E Hwy 20
- 11381 N 209th E
- 11890 S 4050 Rd
- 0 E 106th St N Unit 2543814
- 0 E 106th St N Unit 2546711
- 5163 E Hickory Hollow Dr
- 18757 Valley Ave
- 18680 Valley Ave
- 18657 Valley Ave
- 12192 N Colt Ct
- 18767 Valley Ave
- 18607 Valley Ave
- 12192 Colt Ct
- 18570 Valley Ave
- 12164 N Colt Ct
- 18567 Valley Ave
- 18807 Valley Ave
- 12164 Colt Ct
- 12193 N Colt Ct
- 12193 N Colt Ct
- 12132 Colt Ct
- 12163 N Colt Ct
- 12133 N Colt Ct
- 18897 Valley Ave
- 12133 Colt Ct
- 12103 N Colt Ct