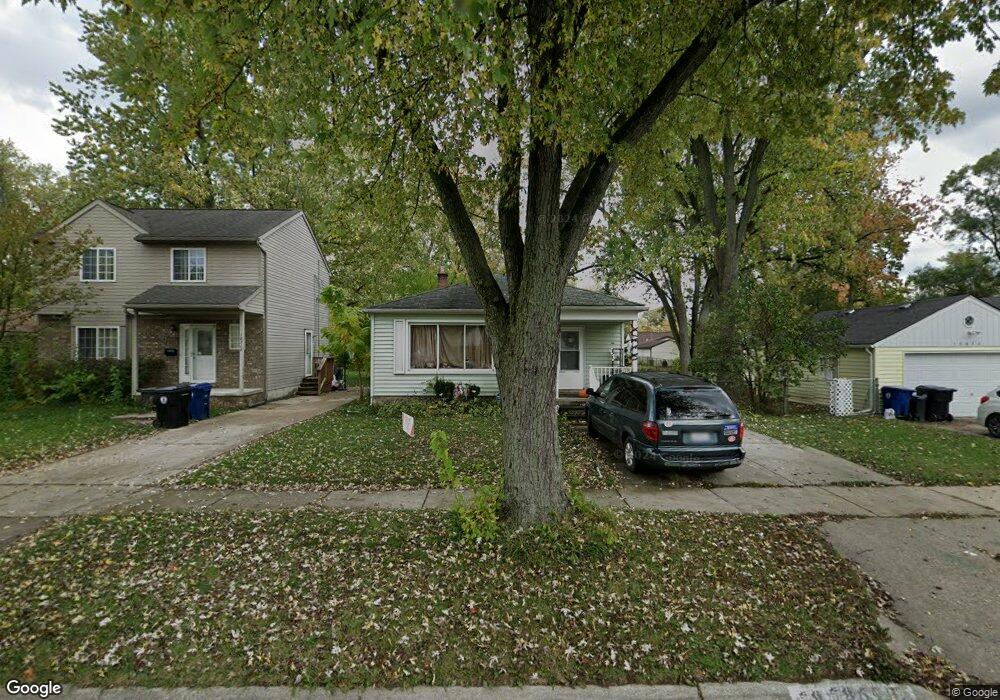
18698 Norborne Redford, MI 48240
Estimated Value: $161,831 - $186,000
3
Beds
1
Bath
1,063
Sq Ft
$165/Sq Ft
Est. Value
About This Home
This home is located at 18698 Norborne, Redford, MI 48240 and is currently estimated at $175,208, approximately $164 per square foot. 18698 Norborne is a home located in Wayne County with nearby schools including Beech Elementary School, Hilbert Middle School, and Redford Union High School.
Ownership History
Date
Name
Owned For
Owner Type
Purchase Details
Closed on
Jun 3, 2010
Sold by
Donovan Shaun and Secretary Of Housing & Urban D
Bought by
Nemeth Elizabeth
Current Estimated Value
Purchase Details
Closed on
Jan 20, 2010
Sold by
Bac Home Loans Servicing Lp
Bought by
The Secretary Of Housing & Urban Develop
Purchase Details
Closed on
Dec 17, 2009
Sold by
Gibson Keair
Bought by
Bac Home Loans Servicing Lp
Purchase Details
Closed on
Apr 28, 2009
Sold by
Tucker Lisa C
Bought by
Gibson Keair
Home Financials for this Owner
Home Financials are based on the most recent Mortgage that was taken out on this home.
Original Mortgage
$92,297
Interest Rate
4.9%
Mortgage Type
FHA
Purchase Details
Closed on
Jan 4, 2007
Sold by
Laws Jason and Laws Morgan
Bought by
Deutsche Bank National Trust Co and Morgan Stanley Home Equity Loan Trust 20
Purchase Details
Closed on
Jul 9, 2004
Sold by
Matties James R and Matties Marie E
Bought by
Laws Jason R
Create a Home Valuation Report for This Property
The Home Valuation Report is an in-depth analysis detailing your home's value as well as a comparison with similar homes in the area
Home Values in the Area
Average Home Value in this Area
Purchase History
| Date | Buyer | Sale Price | Title Company |
|---|---|---|---|
| Nemeth Elizabeth | $24,300 | None Available | |
| The Secretary Of Housing & Urban Develop | -- | None Available | |
| Bac Home Loans Servicing Lp | $101,406 | None Available | |
| Gibson Keair | $94,000 | Continental Title Agency | |
| Deutsche Bank National Trust Co | $100,158 | None Available | |
| Laws Jason R | $118,400 | Multiple |
Source: Public Records
Mortgage History
| Date | Status | Borrower | Loan Amount |
|---|---|---|---|
| Previous Owner | Gibson Keair | $92,297 |
Source: Public Records
Tax History Compared to Growth
Tax History
| Year | Tax Paid | Tax Assessment Tax Assessment Total Assessment is a certain percentage of the fair market value that is determined by local assessors to be the total taxable value of land and additions on the property. | Land | Improvement |
|---|---|---|---|---|
| 2025 | $732 | $78,600 | $0 | $0 |
| 2024 | $732 | $72,000 | $0 | $0 |
| 2023 | $698 | $58,600 | $0 | $0 |
| 2022 | $1,761 | $50,300 | $0 | $0 |
| 2021 | $1,914 | $45,500 | $0 | $0 |
| 2020 | $1,689 | $38,000 | $0 | $0 |
| 2019 | $1,720 | $35,400 | $0 | $0 |
| 2018 | $629 | $25,000 | $0 | $0 |
| 2017 | $1,773 | $24,300 | $0 | $0 |
| 2016 | $1,506 | $24,800 | $0 | $0 |
| 2015 | $2,260 | $22,600 | $0 | $0 |
| 2013 | $2,240 | $23,300 | $0 | $0 |
| 2012 | $1,510 | $25,400 | $6,200 | $19,200 |
Source: Public Records
Map
Nearby Homes
- 18706 Norborne
- 18686 Norborne
- 18710 Norborne
- 18670 Norborne
- 18697 Centralia
- 18683 Centralia
- 18707 Centralia
- 18669 Centralia
- 18727 Centralia
- 18667 Centralia
- 0 Norborne
- 18699 Norborne
- 18693 Norborne
- 18705 Norborne
- 18660 Norborne
- 18665 Centralia
- 18685 Norborne
- 18707 Norborne
- 18679 Norborne
- 18812 Norborne