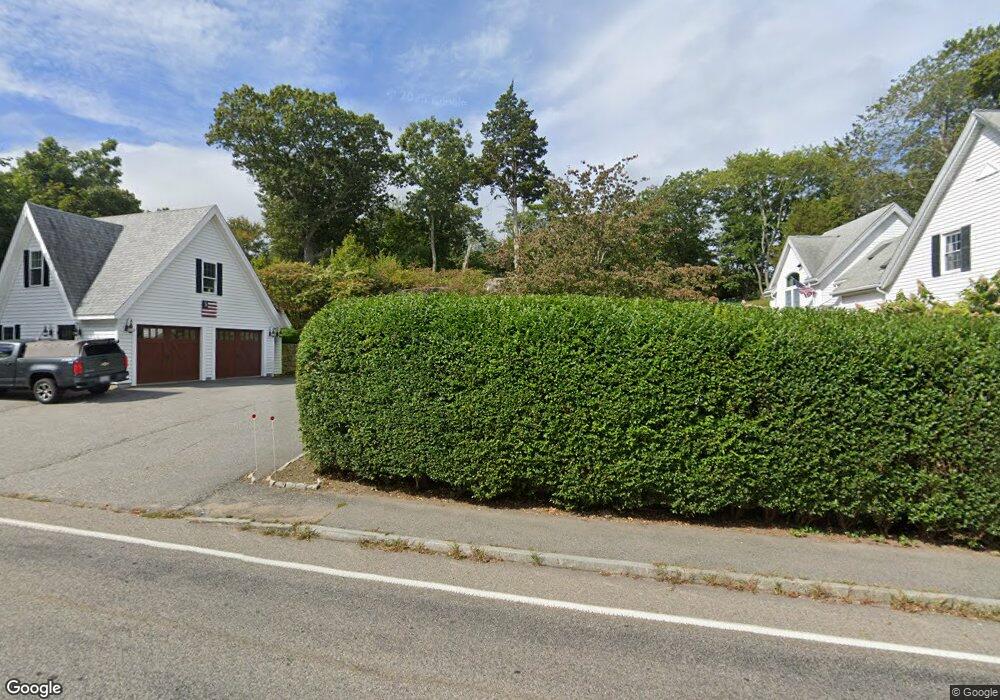
186B Hull St Hingham, MA 02043
Estimated Value: $881,000 - $1,204,000
3
Beds
3
Baths
2,000
Sq Ft
$491/Sq Ft
Est. Value
About This Home
This home is located at 186B Hull St, Hingham, MA 02043 and is currently estimated at $981,996, approximately $490 per square foot. 186B Hull St is a home located in Plymouth County with nearby schools including East Elementary School, St. Paul Elementary School, and Derby Academy.
Ownership History
Date
Name
Owned For
Owner Type
Purchase Details
Closed on
Jan 19, 2022
Sold by
Kobe Rt
Bought by
Robbins Scott M and Robbins Kerry L
Current Estimated Value
Purchase Details
Closed on
Jul 21, 2020
Sold by
Robbins Scott M and Robbins Kerry L
Bought by
Kobe Rt
Purchase Details
Closed on
Aug 24, 2009
Sold by
Thurston Charles W and Thurston Colleen A
Bought by
Robbins Scott M and Robbins Kerry L
Home Financials for this Owner
Home Financials are based on the most recent Mortgage that was taken out on this home.
Original Mortgage
$350,000
Interest Rate
5.19%
Mortgage Type
Purchase Money Mortgage
Purchase Details
Closed on
Aug 23, 1996
Sold by
Bates Mary A
Bought by
Thurston Charles W and Thurston Colleen A
Create a Home Valuation Report for This Property
The Home Valuation Report is an in-depth analysis detailing your home's value as well as a comparison with similar homes in the area
Home Values in the Area
Average Home Value in this Area
Purchase History
| Date | Buyer | Sale Price | Title Company |
|---|---|---|---|
| Robbins Scott M | -- | None Available | |
| Kobe Rt | -- | None Available | |
| Robbins Scott M | $373,000 | -- | |
| Thurston Charles W | $15,000 | -- |
Source: Public Records
Mortgage History
| Date | Status | Borrower | Loan Amount |
|---|---|---|---|
| Previous Owner | Thurston Charles W | $330,000 | |
| Previous Owner | Thurston Charles W | $350,000 | |
| Previous Owner | Thurston Charles W | $209,000 |
Source: Public Records
Tax History Compared to Growth
Tax History
| Year | Tax Paid | Tax Assessment Tax Assessment Total Assessment is a certain percentage of the fair market value that is determined by local assessors to be the total taxable value of land and additions on the property. | Land | Improvement |
|---|---|---|---|---|
| 2025 | $7,872 | $736,400 | $324,200 | $412,200 |
| 2024 | $7,159 | $659,800 | $324,200 | $335,600 |
| 2023 | $6,207 | $620,700 | $301,100 | $319,600 |
| 2022 | $6,726 | $581,800 | $262,500 | $319,300 |
| 2021 | $6,417 | $543,800 | $262,500 | $281,300 |
| 2020 | $6,270 | $543,800 | $262,500 | $281,300 |
| 2019 | $6,210 | $525,800 | $262,500 | $263,300 |
| 2018 | $4,852 | $515,800 | $262,500 | $253,300 |
| 2017 | $5,993 | $489,200 | $262,300 | $226,900 |
| 2016 | $5,449 | $436,300 | $249,800 | $186,500 |
| 2015 | $4,900 | $391,100 | $220,900 | $170,200 |
Source: Public Records
Map
Nearby Homes
- 166 Hull St
- 321 Rockland St
- 6 Grace Dr
- 45 Ocean Ledge Dr
- 10 Ocean Ledge Dr
- 114 Hull St
- 10 Chestnut Place
- 1 Gatehouse Ln Unit 1
- 23 Wyola Rd
- LOT 1B Rockland St
- 20 Rockland House Rd Unit 203
- 121 Nantasket Ave Unit 503
- 6 State Park Rd Unit 2
- 22 Berkley Rd Unit B
- 22 Berkley Rd Unit C
- 4 Atherton Rd
- 25 Oceanside Dr
- 62 Oceanside Dr
- 152 Forest Ave
- 54 Salisbury St Waterfront