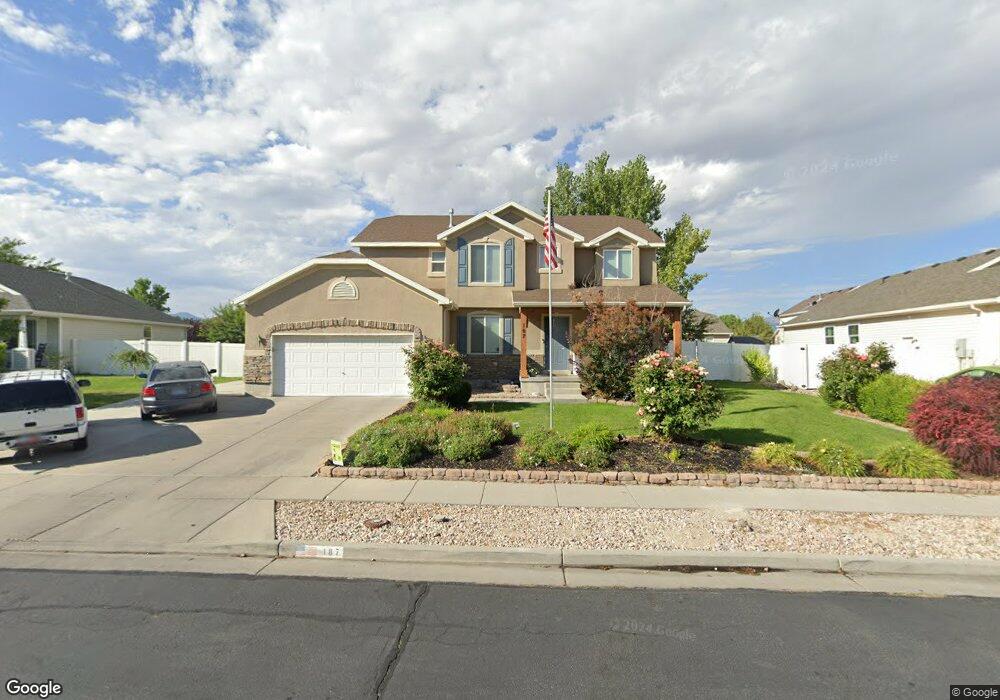
187 Boatsman Cir Tooele, UT 84074
Estimated Value: $529,000 - $579,000
6
Beds
3
Baths
3,173
Sq Ft
$175/Sq Ft
Est. Value
About This Home
This home is located at 187 Boatsman Cir, Tooele, UT 84074 and is currently estimated at $555,222, approximately $174 per square foot. 187 Boatsman Cir is a home located in Tooele County with nearby schools including Stansbury Park Elementary School, Clarke N. Johnsen Junior High School, and Stansbury High School.
Ownership History
Date
Name
Owned For
Owner Type
Purchase Details
Closed on
May 8, 2023
Sold by
Bleak Katie Marie
Bought by
Bleak Bryan and Bleak Katie Marie
Current Estimated Value
Home Financials for this Owner
Home Financials are based on the most recent Mortgage that was taken out on this home.
Original Mortgage
$270,000
Outstanding Balance
$262,396
Interest Rate
6.32%
Mortgage Type
VA
Estimated Equity
$292,826
Purchase Details
Closed on
Oct 26, 2021
Sold by
Anderson Katie Marie
Bought by
Bleak Katie Marie and Bleak Bryan Bert
Purchase Details
Closed on
Oct 24, 2011
Sold by
Steadman Daniel and Steadman Jennifer
Bought by
Anderson Chad Virgil
Home Financials for this Owner
Home Financials are based on the most recent Mortgage that was taken out on this home.
Original Mortgage
$197,125
Interest Rate
4.01%
Mortgage Type
New Conventional
Create a Home Valuation Report for This Property
The Home Valuation Report is an in-depth analysis detailing your home's value as well as a comparison with similar homes in the area
Home Values in the Area
Average Home Value in this Area
Purchase History
| Date | Buyer | Sale Price | Title Company |
|---|---|---|---|
| Bleak Bryan | -- | Meridian Title | |
| Bleak Katie Marie | -- | Accommodation | |
| Anderson Chad Virgil | -- | Access Title Company |
Source: Public Records
Mortgage History
| Date | Status | Borrower | Loan Amount |
|---|---|---|---|
| Open | Bleak Bryan | $270,000 | |
| Previous Owner | Anderson Chad Virgil | $197,125 |
Source: Public Records
Tax History Compared to Growth
Tax History
| Year | Tax Paid | Tax Assessment Tax Assessment Total Assessment is a certain percentage of the fair market value that is determined by local assessors to be the total taxable value of land and additions on the property. | Land | Improvement |
|---|---|---|---|---|
| 2025 | -- | $497,051 | $144,000 | $353,051 |
| 2024 | -- | $273,917 | $79,200 | $194,717 |
| 2023 | $0 | $272,444 | $80,850 | $191,594 |
| 2022 | $1,177 | $293,210 | $73,370 | $219,840 |
| 2021 | $3,090 | $204,806 | $58,245 | $146,561 |
| 2020 | $3,011 | $349,018 | $82,000 | $267,018 |
| 2019 | $2,915 | $332,288 | $82,000 | $250,288 |
| 2018 | $2,695 | $294,314 | $40,000 | $254,314 |
| 2017 | $2,443 | $282,204 | $40,000 | $242,204 |
| 2016 | $2,092 | $137,837 | $22,000 | $115,837 |
| 2015 | $2,092 | $131,280 | $0 | $0 |
| 2014 | -- | $131,280 | $0 | $0 |
Source: Public Records
Map
Nearby Homes
- 5718 Lanyard Ln
- 137 Stern Ct
- 5675 Lanyard Ln
- 122 Stern Ct
- 138 W Morning Glory Cir
- 395 W Broome St
- 5975 Yachtsman Ln
- 5584 N Gentle Breeze Ct
- 133 W Marigold Cir Unit 311
- 5531 Ponderosa Ln
- 62 Fairway Dr
- 485 Delancey St
- 5943 N Bleeker St
- 45 W Streams Edge Way
- 107 Pebble Beach Dr
- 39 Strasbourg Ln
- 5784 Manhattan Dr
- 5546 Ardennes Way
- 5454 Heather Way
- 5668 Ibis Rd
- 177 Boatsman Cir
- 178 Boatsman Cir
- 197 Boatsman Cir
- 208 Regatta Ln
- 208 W Regatta Ln
- 167 Boatsman Cir
- 198 W Regatta Ln
- 198 Regatta Ln
- 216 Regatta Ln
- 216 W Regatta Ln
- 188 Boatsman Cir
- 188 Boatsman Cir Unit 89
- 168 Boatsman Cir
- 207 Boatsman Cir
- 190 Regatta Ln
- 226 Regatta Ln
- 226 W Regatta Ln
- 198 Boatsman Cir
- 157 Boatsman Cir
- 158 Boatsman Cir