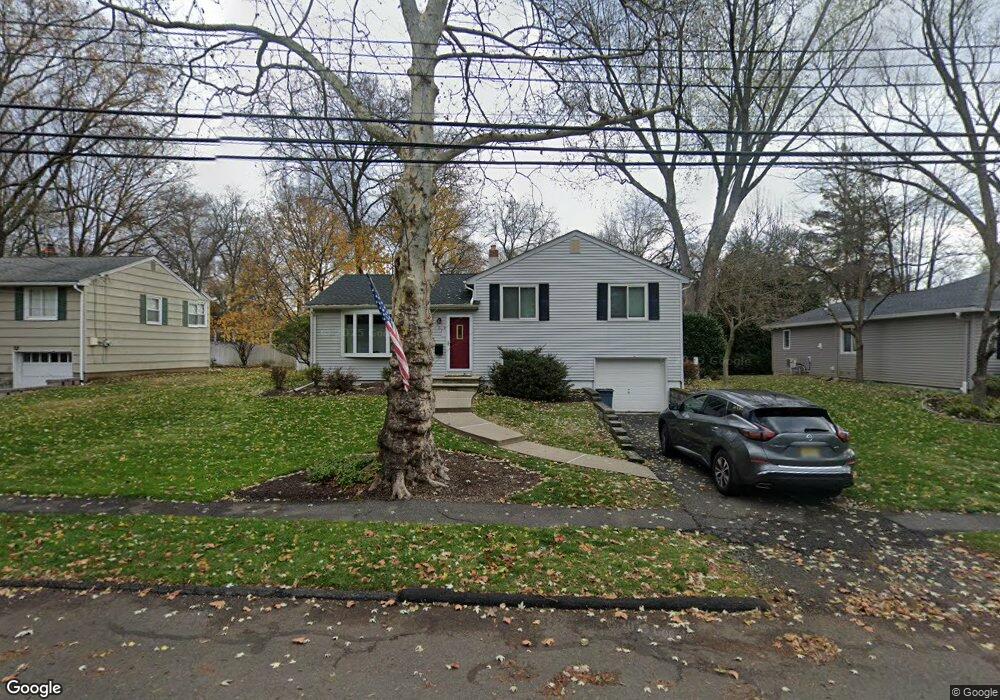
187 Crescent St Closter, NJ 07624
Estimated Value: $825,000 - $969,000
Studio
--
Bath
1,928
Sq Ft
$451/Sq Ft
Est. Value
About This Home
This home is located at 187 Crescent St, Closter, NJ 07624 and is currently estimated at $869,192, approximately $450 per square foot. 187 Crescent St is a home located in Bergen County with nearby schools including Hillside Elementary School, Tenakill Middle School, and Northern Valley Regional High School at Demarest.
Ownership History
Date
Name
Owned For
Owner Type
Purchase Details
Closed on
Nov 23, 2015
Sold by
Higgins Joseph and Higgins Maureen Gill
Bought by
Park Austen Chunghyun and Chung Erika Yunhee
Current Estimated Value
Home Financials for this Owner
Home Financials are based on the most recent Mortgage that was taken out on this home.
Original Mortgage
$404,800
Outstanding Balance
$318,827
Interest Rate
3.83%
Mortgage Type
New Conventional
Estimated Equity
$550,365
Create a Home Valuation Report for This Property
The Home Valuation Report is an in-depth analysis detailing your home's value as well as a comparison with similar homes in the area
Home Values in the Area
Average Home Value in this Area
Purchase History
| Date | Buyer | Sale Price | Title Company |
|---|---|---|---|
| Park Austen Chunghyun | $506,000 | Attorney |
Source: Public Records
Mortgage History
| Date | Status | Borrower | Loan Amount |
|---|---|---|---|
| Open | Park Austen Chunghyun | $404,800 |
Source: Public Records
Tax History
| Year | Tax Paid | Tax Assessment Tax Assessment Total Assessment is a certain percentage of the fair market value that is determined by local assessors to be the total taxable value of land and additions on the property. | Land | Improvement |
|---|---|---|---|---|
| 2025 | $13,219 | $666,400 | $432,500 | $233,900 |
| 2024 | $11,873 | $624,700 | $402,500 | $222,200 |
| 2023 | $11,498 | $553,800 | $337,500 | $216,300 |
| 2022 | $11,498 | $519,800 | $313,800 | $206,000 |
| 2021 | $11,451 | $497,000 | $301,300 | $195,700 |
| 2020 | $11,203 | $499,900 | $302,800 | $197,100 |
| 2019 | $10,919 | $492,500 | $298,300 | $194,200 |
| 2018 | $10,798 | $485,100 | $293,800 | $191,300 |
| 2017 | $9,874 | $432,700 | $280,000 | $152,700 |
| 2016 | $9,688 | $432,700 | $280,000 | $152,700 |
| 2015 | $9,476 | $432,700 | $280,000 | $152,700 |
| 2014 | $9,212 | $432,700 | $280,000 | $152,700 |
Source: Public Records
Map
Nearby Homes
Your Personal Tour Guide
Ask me questions while you tour the home.