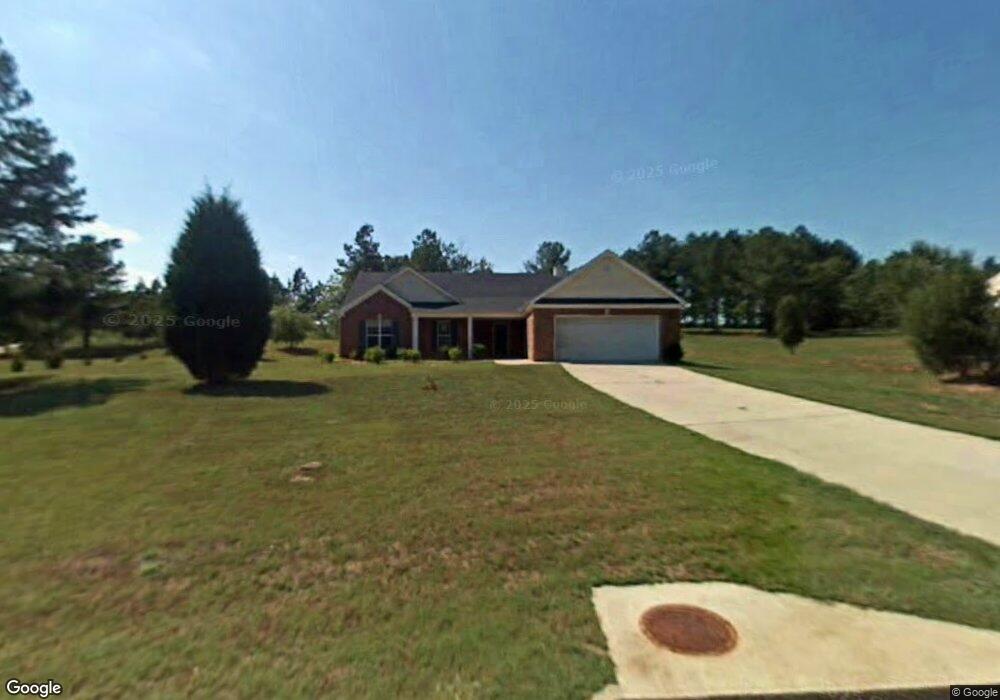
187 Ernie Way Statham, GA 30666
Estimated Value: $325,000 - $341,274
3
Beds
2
Baths
1,701
Sq Ft
$195/Sq Ft
Est. Value
About This Home
This home is located at 187 Ernie Way, Statham, GA 30666 and is currently estimated at $331,069, approximately $194 per square foot. 187 Ernie Way is a home located in Barrow County with nearby schools including Statham Elementary School, Bear Creek Middle School, and Winder-Barrow High School.
Ownership History
Date
Name
Owned For
Owner Type
Purchase Details
Closed on
May 6, 2009
Sold by
Cwabs Inc Series 2005-16
Bought by
Long Brian S
Current Estimated Value
Home Financials for this Owner
Home Financials are based on the most recent Mortgage that was taken out on this home.
Original Mortgage
$90,306
Outstanding Balance
$56,873
Interest Rate
4.79%
Mortgage Type
New Conventional
Estimated Equity
$274,196
Purchase Details
Closed on
May 6, 2008
Sold by
Falkenstein Stephen C
Bought by
Bank Of Ny
Purchase Details
Closed on
Sep 21, 2004
Sold by
Star Hm Builders Inc
Bought by
Falkenstein Stephen C
Home Financials for this Owner
Home Financials are based on the most recent Mortgage that was taken out on this home.
Original Mortgage
$117,215
Interest Rate
8.99%
Mortgage Type
New Conventional
Purchase Details
Closed on
Jan 14, 2004
Sold by
Casta Development Inc
Bought by
Star Home Builders Inc
Purchase Details
Closed on
Aug 29, 2002
Bought by
Casta Development Inc
Create a Home Valuation Report for This Property
The Home Valuation Report is an in-depth analysis detailing your home's value as well as a comparison with similar homes in the area
Home Values in the Area
Average Home Value in this Area
Purchase History
| Date | Buyer | Sale Price | Title Company |
|---|---|---|---|
| Long Brian S | $88,500 | -- | |
| Bank Of Ny | $118,107 | -- | |
| Falkenstein Stephen C | $137,900 | -- | |
| Star Home Builders Inc | $525,000 | -- | |
| Casta Development Inc | -- | -- |
Source: Public Records
Mortgage History
| Date | Status | Borrower | Loan Amount |
|---|---|---|---|
| Open | Long Brian S | $90,306 | |
| Previous Owner | Falkenstein Stephen C | $117,215 |
Source: Public Records
Tax History Compared to Growth
Tax History
| Year | Tax Paid | Tax Assessment Tax Assessment Total Assessment is a certain percentage of the fair market value that is determined by local assessors to be the total taxable value of land and additions on the property. | Land | Improvement |
|---|---|---|---|---|
| 2024 | $3,029 | $105,042 | $16,000 | $89,042 |
| 2023 | $1,772 | $105,442 | $16,000 | $89,442 |
| 2022 | $1,899 | $67,835 | $16,000 | $51,835 |
| 2021 | $1,766 | $59,549 | $12,000 | $47,549 |
| 2020 | $1,624 | $54,862 | $11,600 | $43,262 |
| 2019 | $1,647 | $54,862 | $11,600 | $43,262 |
| 2018 | $1,640 | $54,862 | $11,600 | $43,262 |
| 2017 | $1,681 | $48,170 | $11,600 | $36,570 |
| 2016 | $1,426 | $46,747 | $11,600 | $35,147 |
| 2015 | $1,440 | $47,133 | $11,600 | $35,533 |
| 2014 | $1,244 | $42,779 | $6,860 | $35,919 |
| 2013 | -- | $40,495 | $6,860 | $33,635 |
Source: Public Records
Map
Nearby Homes
- 185 Ernie Way
- 189 Ernie Way
- 183 Ernie Way
- 190 Ernie Way
- 191 Jefferson St
- 0 Ernie Way Unit 7550768
- 0 Ernie Way Unit 3276937
- 186 Ernie Way
- 184 Ernie Way
- 181 Ernie Way
- 188 Ernie Way
- 182 Ernie Way
- 181 Jefferson St
- 180 Ernie Way
- 179 Ernie Way
- 177 Ernie Way
- 177 Ernie Way (31)
- 178 Ernie Way
- 176 Ernie Way
- 175 Ernie Way