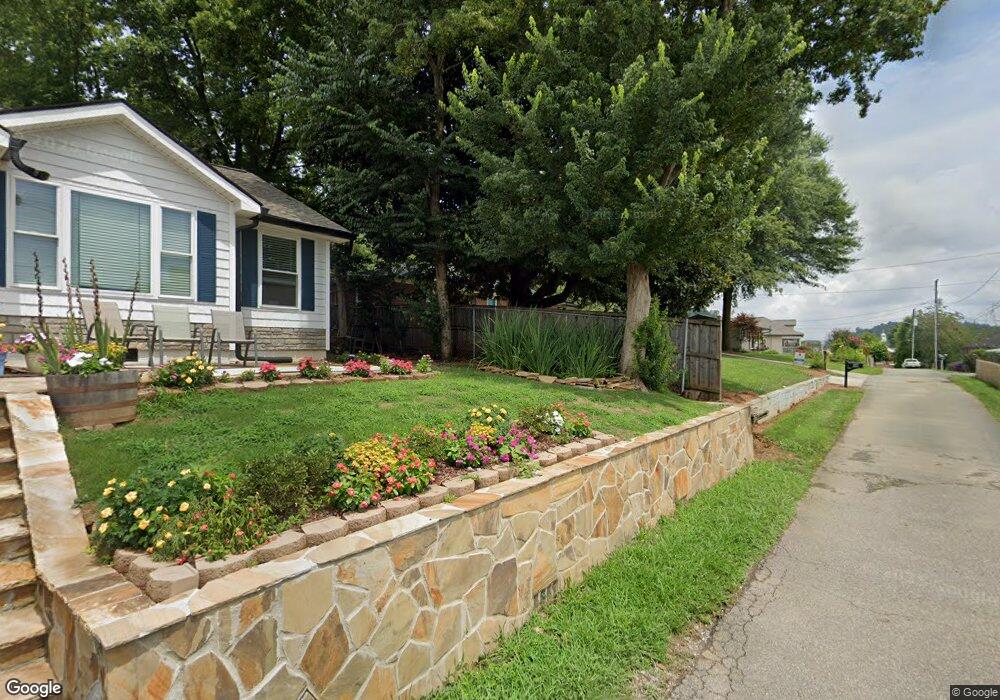
187 Kell St Ellijay, GA 30540
Estimated Value: $265,000 - $309,000
3
Beds
1
Bath
1,225
Sq Ft
$228/Sq Ft
Est. Value
About This Home
This home is located at 187 Kell St, Ellijay, GA 30540 and is currently estimated at $279,692, approximately $228 per square foot. 187 Kell St is a home located in Gilmer County with nearby schools including Ellijay Elementary School, Clear Creek Elementary School, and Clear Creek Middle School.
Ownership History
Date
Name
Owned For
Owner Type
Purchase Details
Closed on
Jul 5, 2017
Sold by
Durden Christopher T
Bought by
Durden Christopher T and Durden Carrie M
Current Estimated Value
Home Financials for this Owner
Home Financials are based on the most recent Mortgage that was taken out on this home.
Original Mortgage
$97,936
Outstanding Balance
$81,368
Interest Rate
3.89%
Mortgage Type
New Conventional
Estimated Equity
$198,324
Purchase Details
Closed on
Nov 7, 2016
Sold by
Michael F
Bought by
Crawford Alene Johnson
Purchase Details
Closed on
Sep 7, 2007
Sold by
Johnson William Ralph
Bought by
Day Mary C and Day Michael F
Home Financials for this Owner
Home Financials are based on the most recent Mortgage that was taken out on this home.
Original Mortgage
$41,326
Interest Rate
6.55%
Mortgage Type
New Conventional
Create a Home Valuation Report for This Property
The Home Valuation Report is an in-depth analysis detailing your home's value as well as a comparison with similar homes in the area
Home Values in the Area
Average Home Value in this Area
Purchase History
| Date | Buyer | Sale Price | Title Company |
|---|---|---|---|
| Durden Christopher T | -- | -- | |
| Durden Christopher T | $103,090 | -- | |
| Crawford Alene Johnson | -- | -- | |
| Day Mary C | $40,000 | -- |
Source: Public Records
Mortgage History
| Date | Status | Borrower | Loan Amount |
|---|---|---|---|
| Open | Durden Christopher T | $97,936 | |
| Closed | Durden Christopher T | $97,936 | |
| Previous Owner | Day Mary C | $41,326 |
Source: Public Records
Tax History Compared to Growth
Tax History
| Year | Tax Paid | Tax Assessment Tax Assessment Total Assessment is a certain percentage of the fair market value that is determined by local assessors to be the total taxable value of land and additions on the property. | Land | Improvement |
|---|---|---|---|---|
| 2024 | $1,520 | $119,340 | $24,000 | $95,340 |
| 2023 | $1,396 | $102,340 | $15,400 | $86,940 |
| 2022 | $801 | $55,700 | $10,000 | $45,700 |
| 2021 | $783 | $45,980 | $10,000 | $35,980 |
| 2020 | $696 | $33,520 | $4,200 | $29,320 |
| 2019 | $759 | $33,520 | $4,200 | $29,320 |
| 2018 | $811 | $35,360 | $6,560 | $28,800 |
| 2017 | $487 | $19,800 | $4,920 | $14,880 |
| 2016 | $513 | $20,440 | $4,920 | $15,520 |
| 2015 | $502 | $20,360 | $4,920 | $15,440 |
| 2014 | $526 | $20,520 | $4,920 | $15,600 |
| 2013 | -- | $21,680 | $4,920 | $16,760 |
Source: Public Records
Map
Nearby Homes
- 84 Logan St
- 66 Logan Ln
- Lot 95 Cedar St
- Lot 95 Cedar St Unit 95
- 14551 Highway 52
- 165 Corbin Hill Rd
- LT 43&44 Reece Mountain Rd
- 00 Highgrove Dr
- N/A Willard Mountain Rd
- 163 Jasmine Ct
- 0 Georgia 52
- LT 104 River Knoll Trail
- 195 River St
- 0 Walhalla Ct Unit 388 10559982
- 0 Walhalla Ct Unit 7491828
- 0 Walhalla Ct Unit 7611949
- 0 Walhalla Ct Unit 10419854
- 0 Walhalla Ct Unit 7491796
- 0 Walhalla Ct Unit Lot 387 8994062
- 0 Walhalla Ct Unit 10419848