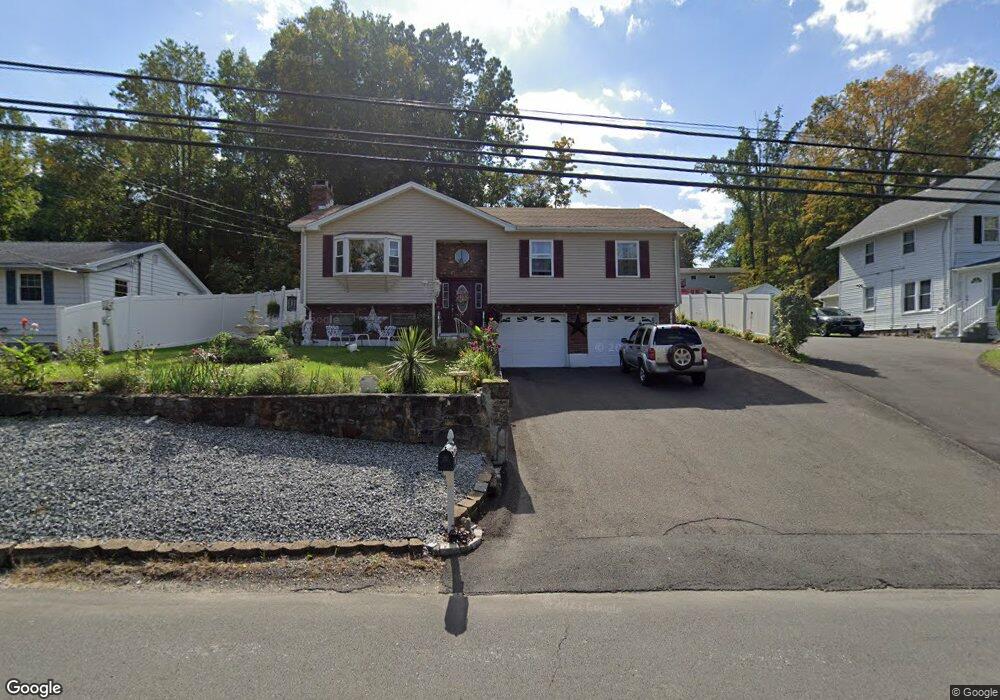
187 May St Naugatuck, CT 06770
Estimated Value: $330,000 - $375,418
3
Beds
2
Baths
1,184
Sq Ft
$302/Sq Ft
Est. Value
About This Home
This home is located at 187 May St, Naugatuck, CT 06770 and is currently estimated at $357,855, approximately $302 per square foot. 187 May St is a home located in New Haven County with nearby schools including City Hill Middle School and Naugatuck High School.
Ownership History
Date
Name
Owned For
Owner Type
Purchase Details
Closed on
Sep 3, 2025
Sold by
Santos Maria F and Santos Manuel J
Bought by
Santos Michael D and Santos Maria F
Current Estimated Value
Purchase Details
Closed on
Nov 18, 2011
Sold by
Santos Manuel J
Bought by
Santos Manuel J and Santos Maria F
Home Financials for this Owner
Home Financials are based on the most recent Mortgage that was taken out on this home.
Original Mortgage
$115,000
Interest Rate
4.33%
Create a Home Valuation Report for This Property
The Home Valuation Report is an in-depth analysis detailing your home's value as well as a comparison with similar homes in the area
Home Values in the Area
Average Home Value in this Area
Purchase History
| Date | Buyer | Sale Price | Title Company |
|---|---|---|---|
| Santos Michael D | -- | -- | |
| Santos Manuel J | -- | -- | |
| Santos Manuel J | -- | -- |
Source: Public Records
Mortgage History
| Date | Status | Borrower | Loan Amount |
|---|---|---|---|
| Previous Owner | Santos Manuel J | $115,000 | |
| Previous Owner | Santos Manuel J | $95,000 |
Source: Public Records
Tax History
| Year | Tax Paid | Tax Assessment Tax Assessment Total Assessment is a certain percentage of the fair market value that is determined by local assessors to be the total taxable value of land and additions on the property. | Land | Improvement |
|---|---|---|---|---|
| 2025 | $7,504 | $188,580 | $28,840 | $159,740 |
| 2024 | $7,881 | $188,580 | $28,840 | $159,740 |
| 2023 | $8,439 | $188,580 | $28,840 | $159,740 |
| 2022 | $6,909 | $144,690 | $30,730 | $113,960 |
| 2021 | $6,909 | $144,690 | $30,730 | $113,960 |
| 2020 | $6,909 | $144,690 | $30,730 | $113,960 |
| 2019 | $6,837 | $144,690 | $30,730 | $113,960 |
| 2018 | $6,108 | $126,330 | $36,980 | $89,350 |
| 2017 | $6,133 | $126,330 | $36,980 | $89,350 |
| 2016 | $6,022 | $126,330 | $36,980 | $89,350 |
| 2015 | $5,757 | $126,330 | $36,980 | $89,350 |
| 2014 | $5,692 | $126,330 | $36,980 | $89,350 |
| 2012 | $5,578 | $166,250 | $46,690 | $119,560 |
Source: Public Records
Map
Nearby Homes
- 137 Lincoln St
- 46 Mulberry St
- 121 Johnson St
- 3 Maple Terrace
- 53 High St
- 130 Celentano Dr
- 190 Auburn St
- 210 Johnson St
- 51 Brook St Unit 6A
- 51 Brook St Unit 3B
- 85 Cold Spring Cir
- 163 City Hill St
- 231 N Main St
- 80 Ward St
- 36 Longview Terrace
- 111 Wooster St Unit 4A
- 79 Ward St
- 18 Cadbury Place
- 25 Tyler Hill Rd
- 119 Prospect St
Your Personal Tour Guide
Ask me questions while you tour the home.