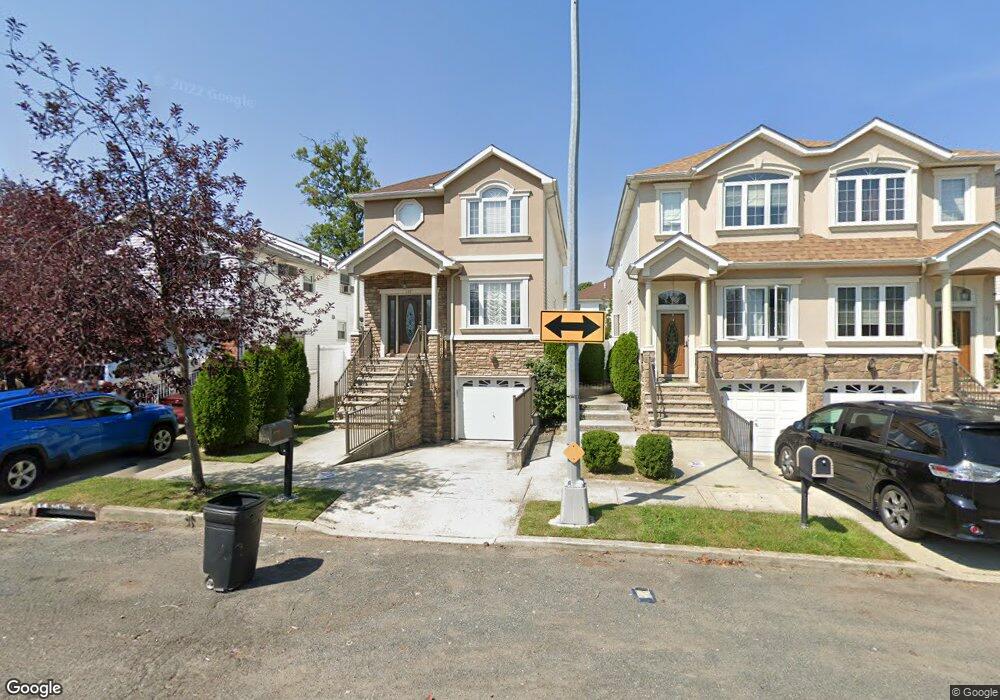
187 Mosely Ave Staten Island, NY 10312
Annadale NeighborhoodEstimated Value: $794,000 - $1,121,000
3
Beds
3
Baths
2,700
Sq Ft
$355/Sq Ft
Est. Value
About This Home
This home is located at 187 Mosely Ave, Staten Island, NY 10312 and is currently estimated at $958,415, approximately $354 per square foot. 187 Mosely Ave is a home located in Richmond County with nearby schools including P.S. 55 The Henry M. Boehm School, I.S. 007 Elias Bernstein, and Tottenville High School.
Ownership History
Date
Name
Owned For
Owner Type
Purchase Details
Closed on
Sep 12, 2008
Sold by
Block 6209 Llc
Bought by
Mikhael Walaa and Mikhael Sherry
Current Estimated Value
Home Financials for this Owner
Home Financials are based on the most recent Mortgage that was taken out on this home.
Original Mortgage
$488,000
Outstanding Balance
$325,364
Interest Rate
6.57%
Mortgage Type
Purchase Money Mortgage
Estimated Equity
$633,051
Create a Home Valuation Report for This Property
The Home Valuation Report is an in-depth analysis detailing your home's value as well as a comparison with similar homes in the area
Home Values in the Area
Average Home Value in this Area
Purchase History
| Date | Buyer | Sale Price | Title Company |
|---|---|---|---|
| Mikhael Walaa | $621,123 | Old Republic National Title |
Source: Public Records
Mortgage History
| Date | Status | Borrower | Loan Amount |
|---|---|---|---|
| Open | Mikhael Walaa | $488,000 |
Source: Public Records
Tax History Compared to Growth
Tax History
| Year | Tax Paid | Tax Assessment Tax Assessment Total Assessment is a certain percentage of the fair market value that is determined by local assessors to be the total taxable value of land and additions on the property. | Land | Improvement |
|---|---|---|---|---|
| 2025 | $8,779 | $58,860 | $9,209 | $49,651 |
| 2024 | $8,779 | $56,640 | $9,029 | $47,611 |
| 2023 | $8,374 | $41,234 | $8,875 | $32,359 |
| 2022 | $8,232 | $44,220 | $11,700 | $32,520 |
| 2021 | $8,485 | $40,320 | $11,700 | $28,620 |
| 2020 | $8,172 | $40,860 | $11,700 | $29,160 |
| 2019 | $7,619 | $44,340 | $11,700 | $32,640 |
| 2018 | $7,005 | $34,362 | $10,721 | $23,641 |
| 2017 | $7,005 | $34,362 | $11,454 | $22,908 |
| 2016 | $6,729 | $33,660 | $11,700 | $21,960 |
| 2015 | $5,825 | $32,174 | $10,448 | $21,726 |
| 2014 | $5,825 | $30,353 | $10,098 | $20,255 |
Source: Public Records
Map
Nearby Homes