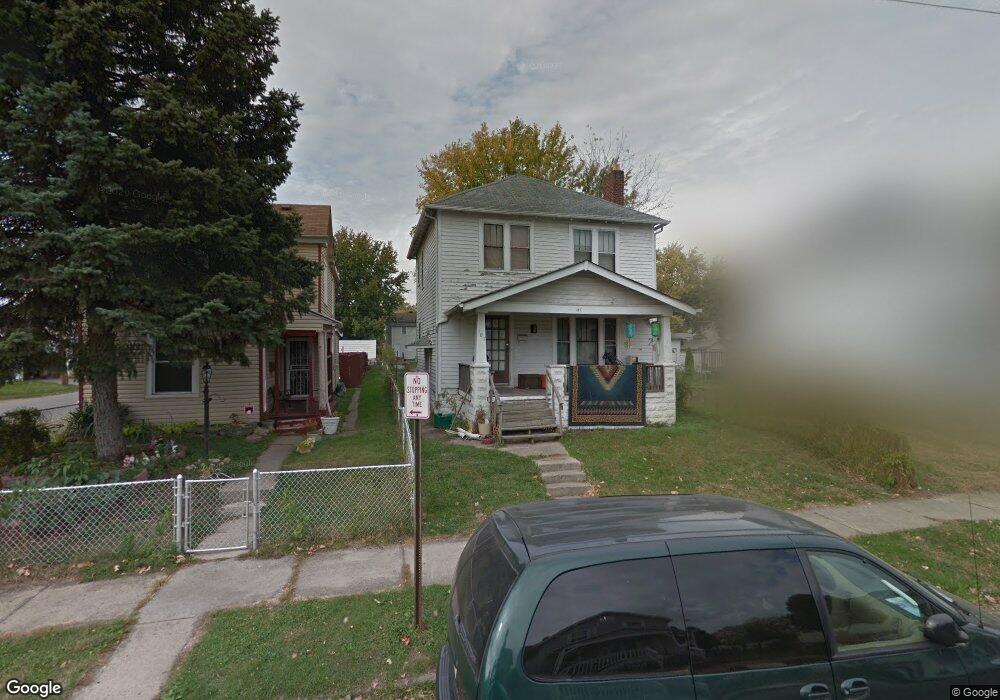
187 S Richardson Ave Columbus, OH 43204
Central Hilltop NeighborhoodEstimated Value: $104,000 - $167,000
3
Beds
1
Bath
1,248
Sq Ft
$108/Sq Ft
Est. Value
About This Home
This home is located at 187 S Richardson Ave, Columbus, OH 43204 and is currently estimated at $134,980, approximately $108 per square foot. 187 S Richardson Ave is a home located in Franklin County with nearby schools including Highland Elementary School, Westmoor Middle School, and West High School.
Ownership History
Date
Name
Owned For
Owner Type
Purchase Details
Closed on
Oct 25, 2004
Sold by
Fannie Mae
Bought by
Musick Jason M
Current Estimated Value
Home Financials for this Owner
Home Financials are based on the most recent Mortgage that was taken out on this home.
Original Mortgage
$46,010
Interest Rate
4.25%
Mortgage Type
Adjustable Rate Mortgage/ARM
Purchase Details
Closed on
Mar 31, 2004
Sold by
Mills Andrea M and Cendant Mortgage Corp
Bought by
Fanniemae and Federal National Mortgage Association
Purchase Details
Closed on
May 24, 2002
Sold by
Arms Deborah J
Bought by
Mills Andrea M
Home Financials for this Owner
Home Financials are based on the most recent Mortgage that was taken out on this home.
Original Mortgage
$71,500
Interest Rate
6.95%
Mortgage Type
Purchase Money Mortgage
Purchase Details
Closed on
Feb 20, 2002
Sold by
Arms Charles R
Bought by
Arms Deborah J
Purchase Details
Closed on
Jun 12, 2001
Sold by
Hoffman Melissa A and Arms Deborah J
Bought by
Arms Charles R and Arms Deborah J
Purchase Details
Closed on
Dec 17, 1986
Bought by
Hoffman Irene E
Create a Home Valuation Report for This Property
The Home Valuation Report is an in-depth analysis detailing your home's value as well as a comparison with similar homes in the area
Home Values in the Area
Average Home Value in this Area
Purchase History
| Date | Buyer | Sale Price | Title Company |
|---|---|---|---|
| Musick Jason M | $48,000 | Title First | |
| Fanniemae | $40,000 | Fidelity National Title Insu | |
| Mills Andrea M | $71,500 | Title First Agency Inc | |
| Arms Deborah J | -- | -- | |
| Arms Charles R | $26,100 | Independent Title | |
| Hoffman Irene E | -- | -- |
Source: Public Records
Mortgage History
| Date | Status | Borrower | Loan Amount |
|---|---|---|---|
| Closed | Musick Jason M | $46,010 | |
| Previous Owner | Mills Andrea M | $71,500 |
Source: Public Records
Tax History Compared to Growth
Tax History
| Year | Tax Paid | Tax Assessment Tax Assessment Total Assessment is a certain percentage of the fair market value that is determined by local assessors to be the total taxable value of land and additions on the property. | Land | Improvement |
|---|---|---|---|---|
| 2024 | $1,866 | $40,710 | $5,600 | $35,110 |
| 2023 | $1,842 | $40,705 | $5,600 | $35,105 |
| 2022 | $750 | $14,110 | $1,820 | $12,290 |
| 2021 | $751 | $14,110 | $1,820 | $12,290 |
| 2020 | $752 | $14,110 | $1,820 | $12,290 |
| 2019 | $824 | $11,350 | $1,510 | $9,840 |
| 2018 | $997 | $11,350 | $1,510 | $9,840 |
| 2017 | $1,050 | $11,350 | $1,510 | $9,840 |
| 2016 | $1,294 | $19,040 | $4,060 | $14,980 |
| 2015 | $1,178 | $19,040 | $4,060 | $14,980 |
| 2014 | $1,181 | $19,040 | $4,060 | $14,980 |
| 2013 | $811 | $22,400 | $4,795 | $17,605 |
Source: Public Records
Map
Nearby Homes
- 232 S Burgess Ave
- 238 S Richardson Ave
- 274 S Richardson Ave
- 224 S Terrace Ave
- 126 S Richardson Ave
- 219 S Ogden Ave
- 121 N Terrace Ave
- 90 S Burgess Ave
- 310 S Ogden Ave
- 2710 Palmetto St
- 66 N Burgess Ave
- 151 S Wayne Ave Unit 153
- 95 S Eureka Ave
- 350 S Ogden Ave
- 262 S Harris Ave
- 334 S Warren Ave
- 349 S Eureka Ave
- 235 S Harris Ave
- 327-329 S Wayne Ave
- 85 S Warren Ave
- 183 S Richardson Ave
- 191 S Richardson Ave
- 179 S Richardson Ave
- 175 S Richardson Ave
- 203 S Richardson Ave
- 171 S Richardson Ave
- 207 S Richardson Ave
- 188 S Burgess Ave
- 184 S Burgess Ave
- 192 S Burgess Ave
- 167 S Richardson Ave
- 180 S Burgess Ave
- 211 S Richardson Ave
- 163 S Richardson Ave
- 188 S Richardson Ave
- 192 S Richardson Ave
- 172 S Burgess Ave
- 206 S Burgess Ave
- 180 S Richardson Ave
- 215 S Richardson Ave