Estimated Value: $145,885 - $262,000
2
Beds
2
Baths
1,560
Sq Ft
$137/Sq Ft
Est. Value
About This Home
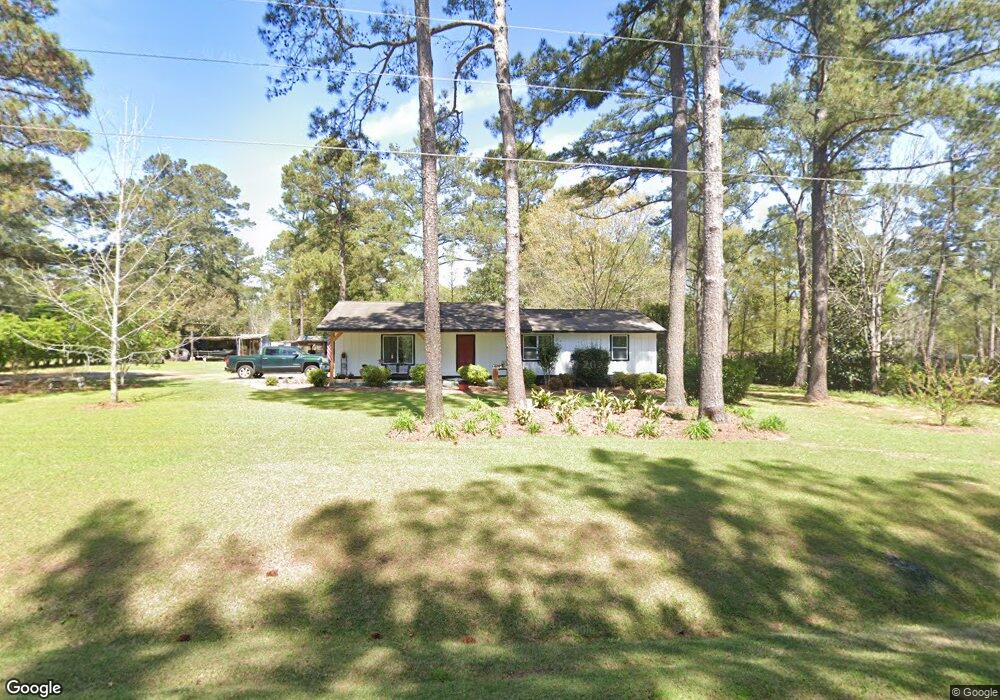
This home is located at 187 Scott Rd, Cairo, GA 39827 and is currently estimated at $213,471, approximately $136 per square foot. 187 Scott Rd is a home located in Grady County with nearby schools including Cairo High School.
Ownership History
Date
Name
Owned For
Owner Type
Purchase Details
Closed on
Oct 4, 2021
Sold by
Kirksey Debra B
Bought by
Hurst Russell Scott and Hurst Miranda
Current Estimated Value
Home Financials for this Owner
Home Financials are based on the most recent Mortgage that was taken out on this home.
Original Mortgage
$37,421
Outstanding Balance
$2,370
Interest Rate
2.8%
Mortgage Type
New Conventional
Estimated Equity
$211,101
Purchase Details
Closed on
May 30, 1984
Sold by
Kirksey Charles R
Bought by
Kirksey Charles R
Create a Home Valuation Report for This Property
The Home Valuation Report is an in-depth analysis detailing your home's value as well as a comparison with similar homes in the area
Purchase History
| Date | Buyer | Sale Price | Title Company |
|---|---|---|---|
| Hurst Russell Scott | $42,000 | -- | |
| Kirksey Charles R | $44,000 | -- |
Source: Public Records
Mortgage History
| Date | Status | Borrower | Loan Amount |
|---|---|---|---|
| Open | Hurst Russell Scott | $37,421 |
Source: Public Records
Tax History
| Year | Tax Paid | Tax Assessment Tax Assessment Total Assessment is a certain percentage of the fair market value that is determined by local assessors to be the total taxable value of land and additions on the property. | Land | Improvement |
|---|---|---|---|---|
| 2024 | $1,573 | $50,299 | $8,000 | $42,299 |
| 2023 | $1,203 | $39,094 | $6,000 | $33,094 |
| 2022 | $1,203 | $39,094 | $6,000 | $33,094 |
| 2021 | $1,207 | $39,094 | $6,000 | $33,094 |
| 2020 | $1,211 | $39,094 | $6,000 | $33,094 |
| 2019 | $1,211 | $39,094 | $6,000 | $33,094 |
| 2018 | $1,079 | $39,094 | $6,000 | $33,094 |
| 2017 | $1,027 | $39,094 | $6,000 | $33,094 |
| 2016 | $882 | $33,682 | $6,000 | $27,682 |
| 2015 | $872 | $33,682 | $6,000 | $27,682 |
| 2014 | $873 | $33,682 | $6,000 | $27,682 |
| 2013 | -- | $36,452 | $6,000 | $30,452 |
Source: Public Records
Map
Nearby Homes
Your Personal Tour Guide
Ask me questions while you tour the home.