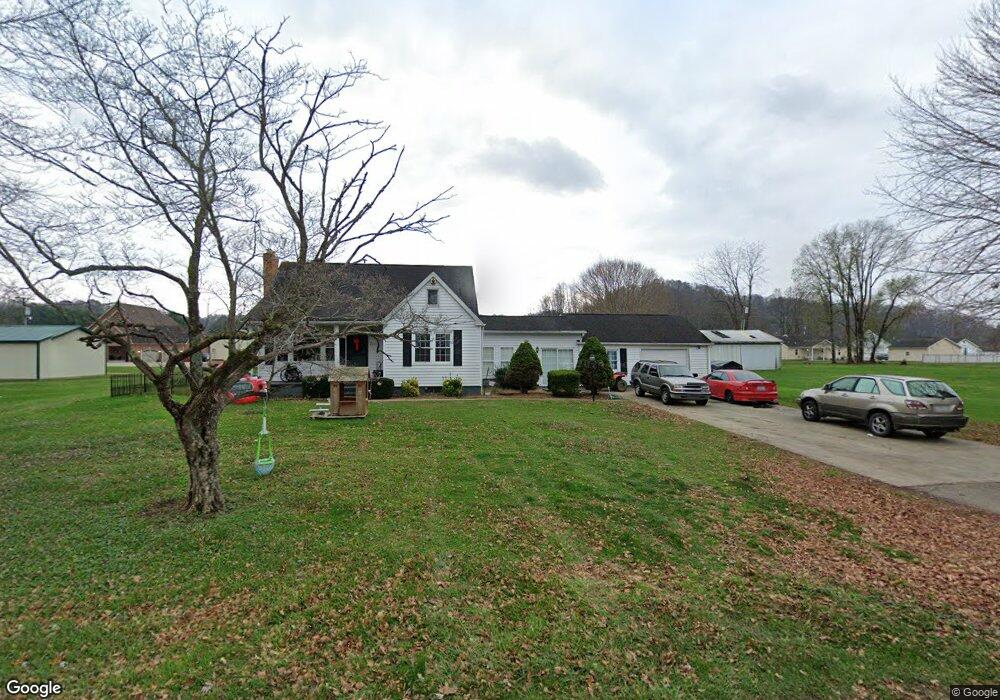
187 Third St South Shore, KY 41175
Estimated Value: $183,000 - $205,331
4
Beds
1
Bath
2,607
Sq Ft
$74/Sq Ft
Est. Value
About This Home
This home is located at 187 Third St, South Shore, KY 41175 and is currently estimated at $193,833, approximately $74 per square foot. 187 Third St is a home located in Greenup County with nearby schools including Greenup County High School.
Ownership History
Date
Name
Owned For
Owner Type
Purchase Details
Closed on
Jun 28, 2023
Sold by
Wolfenbarker Cornette and Wolfenbarker Kaylee
Bought by
Yelley Lonnie Wesley
Current Estimated Value
Home Financials for this Owner
Home Financials are based on the most recent Mortgage that was taken out on this home.
Original Mortgage
$161,616
Outstanding Balance
$157,435
Interest Rate
6.57%
Mortgage Type
New Conventional
Estimated Equity
$36,398
Purchase Details
Closed on
Dec 15, 2017
Sold by
Smith Patrick W
Bought by
Comette Garett and Wolfen Barker Kaylee J
Home Financials for this Owner
Home Financials are based on the most recent Mortgage that was taken out on this home.
Original Mortgage
$99,910
Interest Rate
3.95%
Mortgage Type
New Conventional
Purchase Details
Closed on
May 5, 2009
Sold by
Bentley Brenda K
Bought by
Smith Patrick W
Home Financials for this Owner
Home Financials are based on the most recent Mortgage that was taken out on this home.
Original Mortgage
$66,500
Interest Rate
4.89%
Create a Home Valuation Report for This Property
The Home Valuation Report is an in-depth analysis detailing your home's value as well as a comparison with similar homes in the area
Home Values in the Area
Average Home Value in this Area
Purchase History
| Date | Buyer | Sale Price | Title Company |
|---|---|---|---|
| Yelley Lonnie Wesley | $160,000 | None Listed On Document | |
| Comette Garett | $103,000 | None Available | |
| Smith Patrick W | $91,500 | -- |
Source: Public Records
Mortgage History
| Date | Status | Borrower | Loan Amount |
|---|---|---|---|
| Open | Yelley Lonnie Wesley | $161,616 | |
| Previous Owner | Comette Garett | $99,910 | |
| Previous Owner | Smith Patrick W | $66,500 |
Source: Public Records
Tax History Compared to Growth
Tax History
| Year | Tax Paid | Tax Assessment Tax Assessment Total Assessment is a certain percentage of the fair market value that is determined by local assessors to be the total taxable value of land and additions on the property. | Land | Improvement |
|---|---|---|---|---|
| 2025 | $2,726 | $160,000 | $20,000 | $140,000 |
| 2024 | $2,722 | $160,000 | $20,000 | $140,000 |
| 2023 | $1,653 | $160,000 | $20,000 | $140,000 |
| 2022 | $1,603 | $103,000 | $15,000 | $88,000 |
| 2021 | $1,595 | $103,000 | $15,000 | $88,000 |
| 2020 | $1,570 | $103,000 | $15,000 | $88,000 |
| 2019 | $1,584 | $103,000 | $15,000 | $88,000 |
| 2018 | $1,623 | $103,000 | $15,000 | $88,000 |
| 2017 | $1,387 | $91,500 | $15,000 | $76,500 |
| 2016 | $1,387 | $91,500 | $15,000 | $76,500 |
| 2015 | $1,377 | $91,500 | $15,000 | $76,500 |
| 2014 | $1,365 | $91,500 | $15,000 | $76,500 |
| 2011 | -- | $91,500 | $15,000 | $76,500 |
Source: Public Records
Map
Nearby Homes