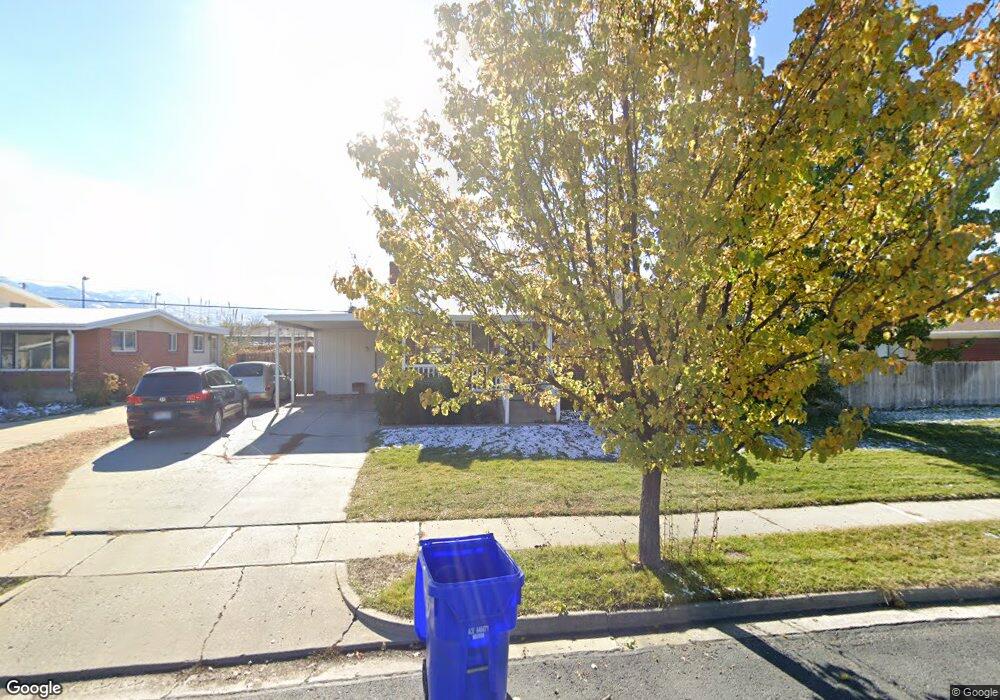
187 W 1400 N Bountiful, UT 84010
Estimated Value: $487,000 - $552,000
4
Beds
2
Baths
2,000
Sq Ft
$256/Sq Ft
Est. Value
About This Home
This home is located at 187 W 1400 N, Bountiful, UT 84010 and is currently estimated at $512,310, approximately $256 per square foot. 187 W 1400 N is a home located in Davis County with nearby schools including Meadowbrook Elementary School, Bountiful Junior High School, and Viewmont High School.
Ownership History
Date
Name
Owned For
Owner Type
Purchase Details
Closed on
Nov 29, 2018
Sold by
Kessler Gary C and Kessler Jennifer T
Bought by
Dc Investment Real Estate Llc
Current Estimated Value
Purchase Details
Closed on
Apr 26, 2012
Sold by
Kessler Gary C
Bought by
Kessler Gary C and Kessler Jennifer T
Home Financials for this Owner
Home Financials are based on the most recent Mortgage that was taken out on this home.
Original Mortgage
$113,500
Interest Rate
3.9%
Mortgage Type
New Conventional
Purchase Details
Closed on
Jun 20, 2001
Sold by
Argyle Scott
Bought by
Kessler Gary C and Kessler Jennifer T
Home Financials for this Owner
Home Financials are based on the most recent Mortgage that was taken out on this home.
Original Mortgage
$143,744
Interest Rate
7.15%
Mortgage Type
FHA
Purchase Details
Closed on
Nov 25, 1996
Sold by
Argyle Scott
Bought by
Argyle Scott
Create a Home Valuation Report for This Property
The Home Valuation Report is an in-depth analysis detailing your home's value as well as a comparison with similar homes in the area
Purchase History
| Date | Buyer | Sale Price | Title Company |
|---|---|---|---|
| Dc Investment Real Estate Llc | -- | Accommodation | |
| Kessler Gary C | -- | Bonneville Superior | |
| Kessler Gary C | -- | Bonneville Superior Tit | |
| Kessler Gary C | -- | Meridian Title Company | |
| Argyle Scott | -- | Inwest Title Services Inc |
Source: Public Records
Mortgage History
| Date | Status | Borrower | Loan Amount |
|---|---|---|---|
| Previous Owner | Kessler Gary C | $113,500 | |
| Previous Owner | Kessler Gary C | $143,744 |
Source: Public Records
Tax History
| Year | Tax Paid | Tax Assessment Tax Assessment Total Assessment is a certain percentage of the fair market value that is determined by local assessors to be the total taxable value of land and additions on the property. | Land | Improvement |
|---|---|---|---|---|
| 2025 | $2,738 | $250,250 | $119,363 | $130,887 |
| 2024 | $2,543 | $241,449 | $103,064 | $138,385 |
| 2023 | $2,451 | $232,100 | $106,134 | $125,965 |
| 2022 | $2,513 | $418,000 | $193,250 | $224,750 |
| 2021 | $2,202 | $317,000 | $138,956 | $178,044 |
| 2020 | $1,946 | $281,000 | $119,846 | $161,154 |
| 2019 | $1,970 | $278,000 | $134,649 | $143,351 |
| 2018 | $1,810 | $251,000 | $132,691 | $118,309 |
| 2016 | $1,558 | $116,930 | $52,919 | $64,011 |
| 2015 | $1,525 | $108,075 | $52,919 | $55,156 |
| 2014 | $1,623 | $118,906 | $52,919 | $65,987 |
| 2013 | -- | $101,917 | $39,809 | $62,108 |
Source: Public Records
Map
Nearby Homes
Your Personal Tour Guide
Ask me questions while you tour the home.