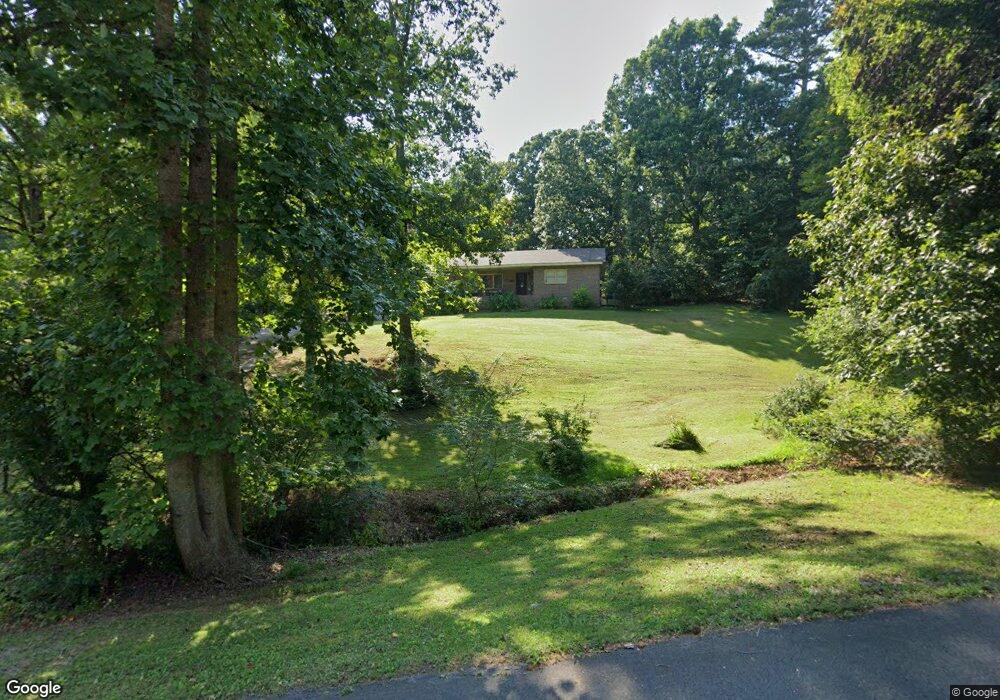
1870 Flair Knoll Dr SE Dalton, GA 30721
Estimated Value: $268,000 - $342,000
3
Beds
2
Baths
1,739
Sq Ft
$168/Sq Ft
Est. Value
About This Home
This home is located at 1870 Flair Knoll Dr SE, Dalton, GA 30721 and is currently estimated at $292,812, approximately $168 per square foot. 1870 Flair Knoll Dr SE is a home located in Whitfield County with nearby schools including Cedar Ridge Elementary School, Eastbrook Middle School, and Southeast Whitfield County High School.
Ownership History
Date
Name
Owned For
Owner Type
Purchase Details
Closed on
Aug 18, 2011
Sold by
Federal National Mortgage Association
Bought by
Overby Anthony B
Current Estimated Value
Home Financials for this Owner
Home Financials are based on the most recent Mortgage that was taken out on this home.
Original Mortgage
$60,623
Outstanding Balance
$43,744
Interest Rate
5.5%
Mortgage Type
FHA
Estimated Equity
$249,068
Purchase Details
Closed on
May 3, 2011
Sold by
Rodriguez Leonardo
Bought by
Suntrust Mtg Inc
Purchase Details
Closed on
Feb 27, 2007
Sold by
Economy William G
Bought by
Rodriguez Leonardo
Home Financials for this Owner
Home Financials are based on the most recent Mortgage that was taken out on this home.
Original Mortgage
$134,830
Interest Rate
6.3%
Mortgage Type
New Conventional
Purchase Details
Closed on
Oct 1, 1999
Bought by
Hilson Bobbie and Hilson Evelyn C
Create a Home Valuation Report for This Property
The Home Valuation Report is an in-depth analysis detailing your home's value as well as a comparison with similar homes in the area
Home Values in the Area
Average Home Value in this Area
Purchase History
| Date | Buyer | Sale Price | Title Company |
|---|---|---|---|
| Overby Anthony B | $62,200 | -- | |
| Suntrust Mtg Inc | $65,600 | -- | |
| Federal National Mtg | $65,600 | -- | |
| Rodriguez Leonardo | $139,000 | -- | |
| Federal National Mtg Associati | -- | -- | |
| Hilson Bobbie | -- | -- |
Source: Public Records
Mortgage History
| Date | Status | Borrower | Loan Amount |
|---|---|---|---|
| Open | Federal National Mtg | $60,623 | |
| Closed | Federal National Mtg | $5,000 | |
| Previous Owner | Federal National Mtg Associati | $134,830 |
Source: Public Records
Tax History Compared to Growth
Tax History
| Year | Tax Paid | Tax Assessment Tax Assessment Total Assessment is a certain percentage of the fair market value that is determined by local assessors to be the total taxable value of land and additions on the property. | Land | Improvement |
|---|---|---|---|---|
| 2024 | $1,790 | $102,610 | $15,000 | $87,610 |
| 2023 | $1,790 | $66,879 | $11,200 | $55,679 |
| 2022 | $1,390 | $55,681 | $11,200 | $44,481 |
| 2021 | $1,407 | $56,234 | $11,200 | $45,034 |
| 2020 | $1,443 | $56,234 | $11,200 | $45,034 |
| 2019 | $1,362 | $53,034 | $8,000 | $45,034 |
| 2018 | $1,322 | $51,254 | $7,200 | $44,054 |
| 2017 | $1,323 | $51,254 | $7,200 | $44,054 |
| 2016 | $1,094 | $44,959 | $4,620 | $40,339 |
| 2014 | $1,011 | $44,959 | $4,620 | $40,339 |
| 2013 | -- | $44,959 | $4,620 | $40,339 |
Source: Public Records
Map
Nearby Homes
- 1142 Ben Hill Rd SE
- 3657 Airport Rd
- 01 Headrick Cir SE
- 00 Headrick Cir SE
- 2200 Ridge Rd SE
- 1271 Ridge Rd SE
- 296 Wagner Dr
- 215 Wagner Dr
- 00 Hill Rd
- 1401 Eastbrook Dr SE
- 129 Hillwood Dr
- 00 Tibbs Bridge Rd
- 760 Keith Rd SE
- 4322 Banks Dr SE
- 118 Hill Rd
- 0 Tibbs Bridge Rd SE
- 1401 Eastbrook Rd SE
- 185 Cedar Ridge Rd
- TBD Old Grade Rd
- 0 Old Grade Rd
- 1859 Flair Knoll Dr SE
- 1880 Flair Knoll Dr SE
- 1873 Flair Knoll Dr SE
- 0 Flair Knoll Dr SE Unit 1351836
- 0 Flair Knoll Dr SE Unit 1238830
- 0 Flair Knoll Dr SE Unit RTC2733468
- 0 Flair Knoll Dr SE Unit RTC2726724
- 0 Flair Knoll Dr SE Unit 1293639
- 0 Flair Knoll Dr SE Unit 1258417
- 0 Flair Knoll Dr SE Unit 90892
- 0 Flair Knoll Dr SE Unit 92442
- 0 Flair Knoll Dr SE Unit 95095
- 0 Flair Knoll Dr SE Unit 111400
- 0 Flair Knoll Dr SE Unit 113783
- 0 Flair Knoll Dr SE Unit RTC2336081
- 94 Flair Knoll Dr SE
- 0 Flair Knoll Dr SE
- 1850 Flair Knoll Dr SE
- 1855 Flair Knoll Dr SE
- 208 Matlock Dr SE