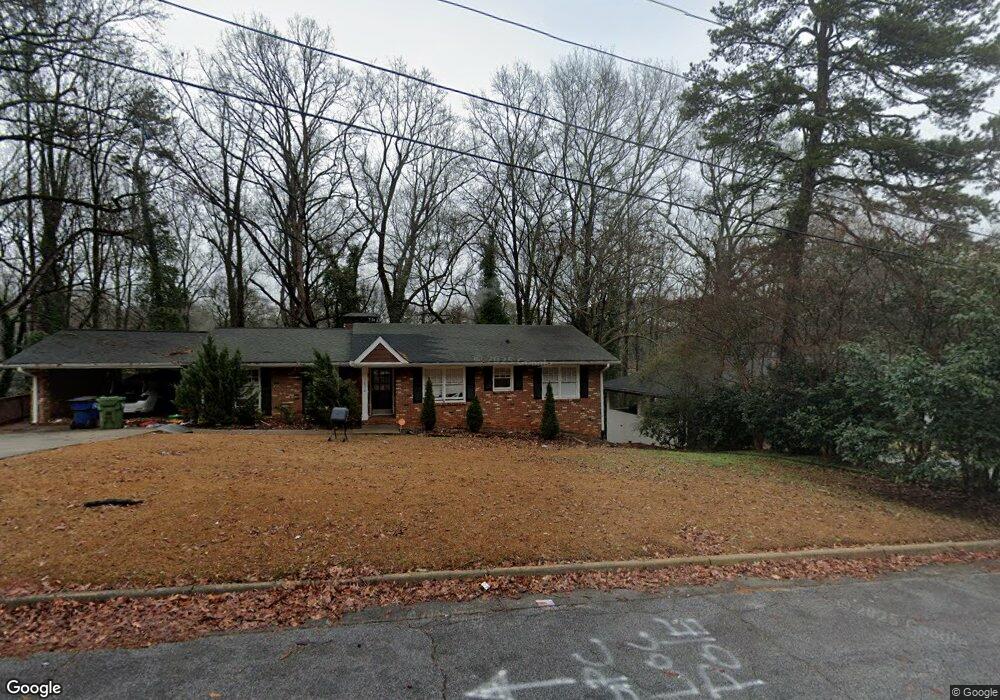
1870 Montvallo Terrace SE Atlanta, GA 30316
East Atlanta NeighborhoodEstimated Value: $472,000 - $536,000
4
Beds
3
Baths
1,500
Sq Ft
$337/Sq Ft
Est. Value
About This Home
This home is located at 1870 Montvallo Terrace SE, Atlanta, GA 30316 and is currently estimated at $504,875, approximately $336 per square foot. 1870 Montvallo Terrace SE is a home located in DeKalb County with nearby schools including Burgess-Peterson Elementary School, King Middle School, and Maynard Holbrook Jackson High School.
Ownership History
Date
Name
Owned For
Owner Type
Purchase Details
Closed on
Aug 26, 2008
Sold by
Asset Backed 2004-Wwf1
Bought by
Montvallo Terra Trust
Current Estimated Value
Purchase Details
Closed on
Dec 6, 2005
Sold by
Matthews Derrick
Bought by
Wachovia Bk Na
Purchase Details
Closed on
Nov 4, 2004
Sold by
Haskell Willie
Bought by
Matthews Derrick
Home Financials for this Owner
Home Financials are based on the most recent Mortgage that was taken out on this home.
Original Mortgage
$198,000
Interest Rate
5.77%
Mortgage Type
New Conventional
Purchase Details
Closed on
Feb 8, 2000
Sold by
Arvinger De'Angleo
Bought by
Mcclendon Glenn
Purchase Details
Closed on
Apr 1, 1997
Sold by
Shy Peter R and Shy Cynthia H
Bought by
Nationsbanc Mortgage Corp
Create a Home Valuation Report for This Property
The Home Valuation Report is an in-depth analysis detailing your home's value as well as a comparison with similar homes in the area
Home Values in the Area
Average Home Value in this Area
Purchase History
| Date | Buyer | Sale Price | Title Company |
|---|---|---|---|
| Montvallo Terra Trust | $75,000 | -- | |
| Wachovia Bk Na | $185,000 | -- | |
| Matthews Derrick | $220,000 | -- | |
| Mcclendon Glenn | -- | -- | |
| Nationsbanc Mortgage Corp | $65,696 | -- |
Source: Public Records
Mortgage History
| Date | Status | Borrower | Loan Amount |
|---|---|---|---|
| Previous Owner | Matthews Derrick | $198,000 |
Source: Public Records
Tax History Compared to Growth
Tax History
| Year | Tax Paid | Tax Assessment Tax Assessment Total Assessment is a certain percentage of the fair market value that is determined by local assessors to be the total taxable value of land and additions on the property. | Land | Improvement |
|---|---|---|---|---|
| 2025 | $2,266 | $194,720 | $40,640 | $154,080 |
| 2024 | $1,936 | $193,560 | $40,640 | $152,920 |
| 2023 | $1,936 | $162,920 | $39,101 | $123,819 |
| 2022 | $1,542 | $162,920 | $39,101 | $123,819 |
| 2021 | $1,542 | $162,920 | $39,600 | $123,320 |
| 2020 | $995 | $96,000 | $8,640 | $87,360 |
| 2019 | $990 | $96,000 | $8,640 | $87,360 |
| 2018 | $648 | $101,320 | $9,000 | $92,320 |
| 2017 | $515 | $52,200 | $8,352 | $43,848 |
| 2016 | $521 | $52,200 | $8,352 | $43,848 |
| 2014 | $183 | $20,000 | $7,200 | $12,800 |
Source: Public Records
Map
Nearby Homes
- 1103 Leah Ln SE
- 1895 Flat Shoals Rd SE
- 1110 Hilburn Dr SE Unit 2
- 1905 Flat Shoals Rd SE
- 1046 Leah Ln SE
- 1833 Flat Shoals Rd SE
- 1876 Flat Shoals Rd SE
- 1770 Russell St SE
- 1770 Rockland Dr SE
- 1172 Fayetteville Rd SE Unit A & B
- 920 Stallings Ave SE
- 1723 Flat Shoals Rd SE
- 954 Bouldercrest Dr SE
- 2437 Charleston Pointe Ct SE Unit 2
- 1691 Flat Shoals Rd SE
- 1421 Smith St SE
- 1400 Smith St SE
- 2377 Charleston Pointe SE
- 796 Flat Shoals Way SE
- 1878 Montvallo Terrace SE
- 1862 Montvallo Terrace SE
- 0 Montvallo Terrace SE Unit 8706571
- 0 Montvallo Terrace SE Unit 8392189
- 0 Montvallo Terrace SE Unit 8340156
- 0 Montvallo Terrace SE Unit 7561449
- 1019 Hilburn Dr SE
- 1011 Hilburn Dr SE
- 1890 Montvallo Terrace SE
- 1127 Leah Ln SE
- 1001 Hilburn Dr SE
- 1883 Montvallo Terrace SE
- 1121 Leah Ln SE
- 1114 Leah Ln SE
- 993 Hilburn Dr SE
- 1115 Leah Ln SE
- 1037 Hilburn Dr SE
- 1891 Montvallo Terrace SE
- 1119 Mckenna Place SE
- 987 Hilburn Dr SE