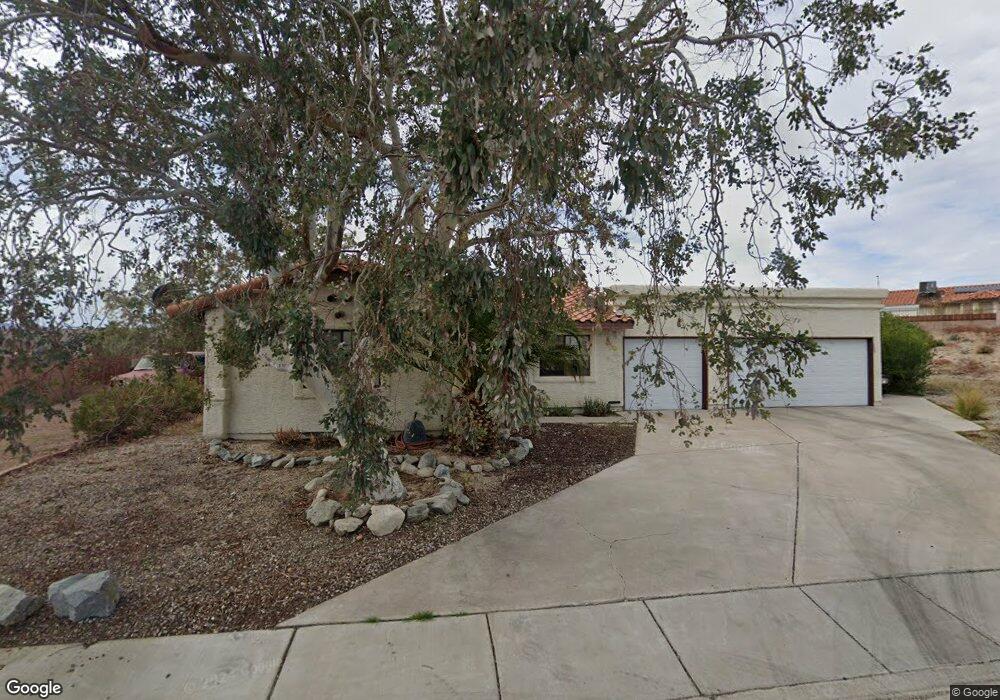
1870 Palmera Ct Laughlin, NV 89029
Estimated Value: $275,320 - $330,000
3
Beds
2
Baths
1,260
Sq Ft
$233/Sq Ft
Est. Value
About This Home
This home is located at 1870 Palmera Ct, Laughlin, NV 89029 and is currently estimated at $293,080, approximately $232 per square foot. 1870 Palmera Ct is a home located in Clark County with nearby schools including William G. Bennett Elementary School and Laughlin Junior/Senior High School.
Ownership History
Date
Name
Owned For
Owner Type
Purchase Details
Closed on
Feb 2, 2012
Sold by
Plamondon Ron and Breslin Gail M
Bought by
Plamondon Ronald R and Breslin Gail M
Current Estimated Value
Purchase Details
Closed on
Feb 5, 2003
Sold by
Tisdell Annie Ruth
Bought by
Plamondon Ron and Breslin Gail M
Purchase Details
Closed on
Dec 24, 2001
Sold by
Horakh Janet P
Bought by
Tisdell Annie Ruth
Home Financials for this Owner
Home Financials are based on the most recent Mortgage that was taken out on this home.
Original Mortgage
$108,000
Interest Rate
6.73%
Purchase Details
Closed on
Dec 27, 1995
Sold by
Federal Home Loan Mortgage Corporation
Bought by
Horakh Janet P
Home Financials for this Owner
Home Financials are based on the most recent Mortgage that was taken out on this home.
Original Mortgage
$60,100
Interest Rate
7.37%
Purchase Details
Closed on
Feb 24, 1995
Sold by
Pedregosa Maria Divina Sanga
Bought by
Federal Home Loan Mortgage Corporation
Create a Home Valuation Report for This Property
The Home Valuation Report is an in-depth analysis detailing your home's value as well as a comparison with similar homes in the area
Purchase History
| Date | Buyer | Sale Price | Title Company |
|---|---|---|---|
| Plamondon Ronald R | -- | None Available | |
| Plamondon Ron | $150,000 | Nevada Title Company | |
| Tisdell Annie Ruth | $135,000 | Nevada Title Company | |
| Horakh Janet P | $88,000 | Nevada Title Company | |
| Federal Home Loan Mortgage Corporation | $100,144 | Land Title |
Source: Public Records
Mortgage History
| Date | Status | Borrower | Loan Amount |
|---|---|---|---|
| Previous Owner | Tisdell Annie Ruth | $108,000 | |
| Previous Owner | Horakh Janet P | $60,100 |
Source: Public Records
Tax History
| Year | Tax Paid | Tax Assessment Tax Assessment Total Assessment is a certain percentage of the fair market value that is determined by local assessors to be the total taxable value of land and additions on the property. | Land | Improvement |
|---|---|---|---|---|
| 2026 | $1,301 | $48,515 | $12,950 | $35,565 |
| 2025 | $1,264 | $49,267 | $12,600 | $36,667 |
| 2024 | $1,227 | $49,267 | $12,600 | $36,667 |
| 2023 | $1,227 | $56,274 | $21,000 | $35,274 |
| 2022 | $1,191 | $48,609 | $16,100 | $32,509 |
| 2021 | $1,157 | $45,526 | $14,350 | $31,176 |
| 2020 | $1,121 | $45,248 | $14,000 | $31,248 |
| 2019 | $1,088 | $42,559 | $11,550 | $31,009 |
| 2018 | $1,056 | $41,211 | $11,200 | $30,011 |
| 2017 | $1,351 | $40,340 | $9,800 | $30,540 |
| 2016 | $1,000 | $40,968 | $9,800 | $31,168 |
| 2015 | $998 | $36,941 | $8,750 | $28,191 |
| 2014 | $969 | $28,086 | $7,000 | $21,086 |
Source: Public Records
Map
Nearby Homes
- 1826 Dunes Ct
- 1980 Las Palmas Ln Unit 159
- 1940 Las Palmas Ln Unit 171
- 1940 Las Palmas Ln Unit 272
- 1944 Las Palmas Ln Unit 273
- 1948 Las Palmas Ln Unit 277
- 1948 Las Palmas Ln Unit 279
- 1972 Las Palmas Ln Unit 251
- 1972 Las Palmas Ln Unit 249
- 1928 Las Palmas Ln Unit 228
- 2888 Cattail Cove St
- 1964 Las Palmas Ln Unit 141
- 2772 Brinkley Manor St
- 2078 Willow Bay Rd
- 2926 Shimmering Bay St
- 2061 Hunt Woods Ct
- 2748 Brinkley Manor St
- 2081 Hunt Woods Ct
- 2061 Alki Beach Ave
- 2935 Shimmering Bay St
- 1860 Palmera Ct
- 1859 Palmera Ct
- 2832 Biscaya Dr
- 2840 Biscaya Dr
- 2824 Biscaya Dr
- 1881 Maricopa Dr
- 2848 Biscaya Dr
- 1850 Palmera Ct
- 1849 Palmera Ct
- 1871 Maricopa Dr
- 2856 Biscaya Dr
- 1840 Palmera Ct
- 1839 Palmera Ct
- 1838 Oasis Ct
- 2864 Biscaya Dr
- 2839 Biscaya Dr
- 1841 Maricopa Dr
- 1830 Palmera Ct
- 2815 Biscaya Dr
- 2847 Biscaya Dr
Your Personal Tour Guide
Ask me questions while you tour the home.