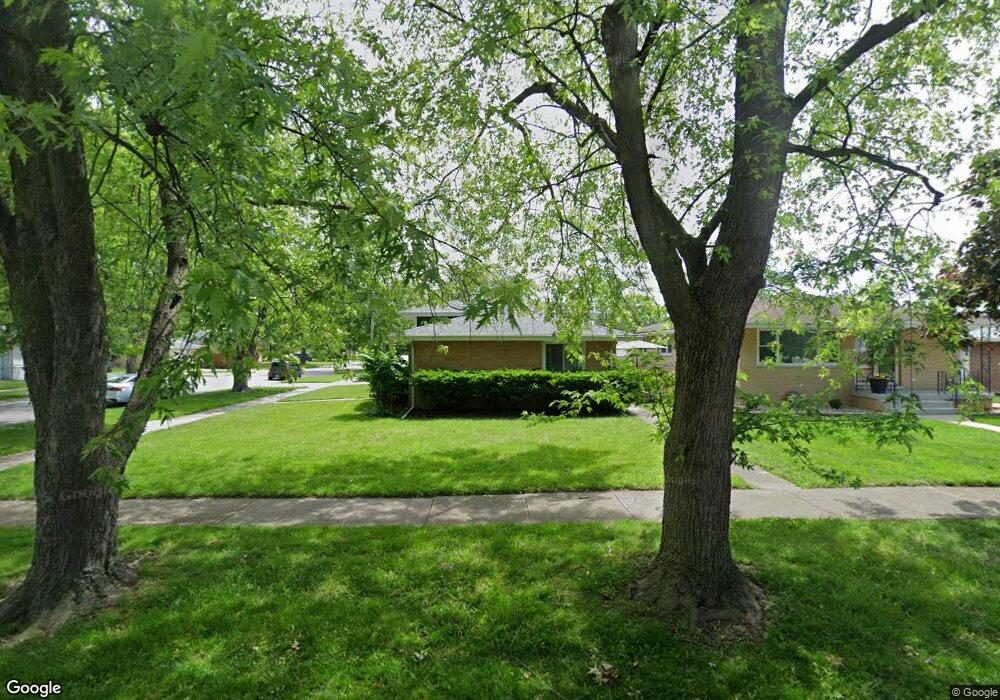
18701 Sherman St Lansing, IL 60438
Estimated Value: $216,000 - $238,984
3
Beds
2
Baths
1,152
Sq Ft
$197/Sq Ft
Est. Value
About This Home
This home is located at 18701 Sherman St, Lansing, IL 60438 and is currently estimated at $226,496, approximately $196 per square foot. 18701 Sherman St is a home located in Cook County with nearby schools including Nathan Hale Elementary School, Heritage Middle School, and Thornton Fractnl So High School.
Ownership History
Date
Name
Owned For
Owner Type
Purchase Details
Closed on
Mar 18, 2008
Sold by
Bank Of New York
Bought by
Mister Gloria
Current Estimated Value
Home Financials for this Owner
Home Financials are based on the most recent Mortgage that was taken out on this home.
Original Mortgage
$137,025
Outstanding Balance
$86,955
Interest Rate
6.09%
Mortgage Type
FHA
Estimated Equity
$139,541
Purchase Details
Closed on
Jan 29, 2007
Sold by
Richmond June
Bought by
Bank Of New York and The Certificate Holders Cwabs Inc Asset
Purchase Details
Closed on
Sep 2, 2005
Sold by
Dabrowski Stanley J and Dabrowski Theresa M
Bought by
Richmond June
Home Financials for this Owner
Home Financials are based on the most recent Mortgage that was taken out on this home.
Original Mortgage
$173,755
Interest Rate
9.2%
Mortgage Type
New Conventional
Create a Home Valuation Report for This Property
The Home Valuation Report is an in-depth analysis detailing your home's value as well as a comparison with similar homes in the area
Home Values in the Area
Average Home Value in this Area
Purchase History
| Date | Buyer | Sale Price | Title Company |
|---|---|---|---|
| Mister Gloria | $140,000 | First American Title | |
| Bank Of New York | -- | None Available | |
| Richmond June | $183,000 | Residential Title Services |
Source: Public Records
Mortgage History
| Date | Status | Borrower | Loan Amount |
|---|---|---|---|
| Open | Mister Gloria | $137,025 | |
| Previous Owner | Richmond June | $173,755 |
Source: Public Records
Tax History Compared to Growth
Tax History
| Year | Tax Paid | Tax Assessment Tax Assessment Total Assessment is a certain percentage of the fair market value that is determined by local assessors to be the total taxable value of land and additions on the property. | Land | Improvement |
|---|---|---|---|---|
| 2024 | $6,413 | $21,000 | $3,517 | $17,483 |
| 2023 | $3,962 | $21,000 | $3,517 | $17,483 |
| 2022 | $3,962 | $13,592 | $2,990 | $10,602 |
| 2021 | $5,806 | $13,590 | $2,989 | $10,601 |
| 2020 | $5,554 | $13,590 | $2,989 | $10,601 |
| 2019 | $4,901 | $12,909 | $2,637 | $10,272 |
| 2018 | $4,764 | $12,909 | $2,637 | $10,272 |
| 2017 | $4,693 | $12,909 | $2,637 | $10,272 |
| 2016 | $4,762 | $12,431 | $2,461 | $9,970 |
| 2015 | $4,556 | $12,431 | $2,461 | $9,970 |
| 2014 | $4,475 | $12,431 | $2,461 | $9,970 |
| 2013 | $4,715 | $14,082 | $2,461 | $11,621 |
Source: Public Records
Map
Nearby Homes
- 18747 Sherman St
- 3225 Otto St
- 3461 S Manor Dr
- 3620 186th St Unit 405
- 3640 186th St Unit 101
- 3363 S Manor Dr
- 18504 Wentworth Ave
- 18855 Burnham Ave Unit 234
- 18855 Burnham Ave Unit 132
- 18855 Burnham Ave Unit 231
- 3240 N Manor Dr Unit 130
- 3251 N Schultz Dr
- 18828 Greenbay Ave
- 18864 Greenbay Ave
- 18 Timrick Dr
- 3320 191st St
- 19061 Wentworth Ave
- 18443 Maple St
- 18405 Wentworth Ave Unit 1D
- 18316 Sherman St
- 18721 Sherman St
- 18655 Sherman St
- 18714 William St
- 18720 William St
- 18731 Sherman St
- 18651 Sherman St
- 18726 William St
- 18658 William St
- 18716 Sherman St
- 18724 Sherman St
- 18737 Sherman St
- 18730 William St
- 18658 Sherman St
- 18730 Sherman St
- 18730 Sherman St
- 18645 Sherman St
- 18650 William St
- 18736 William St
- 18743 Sherman St
- 18736 Sherman St