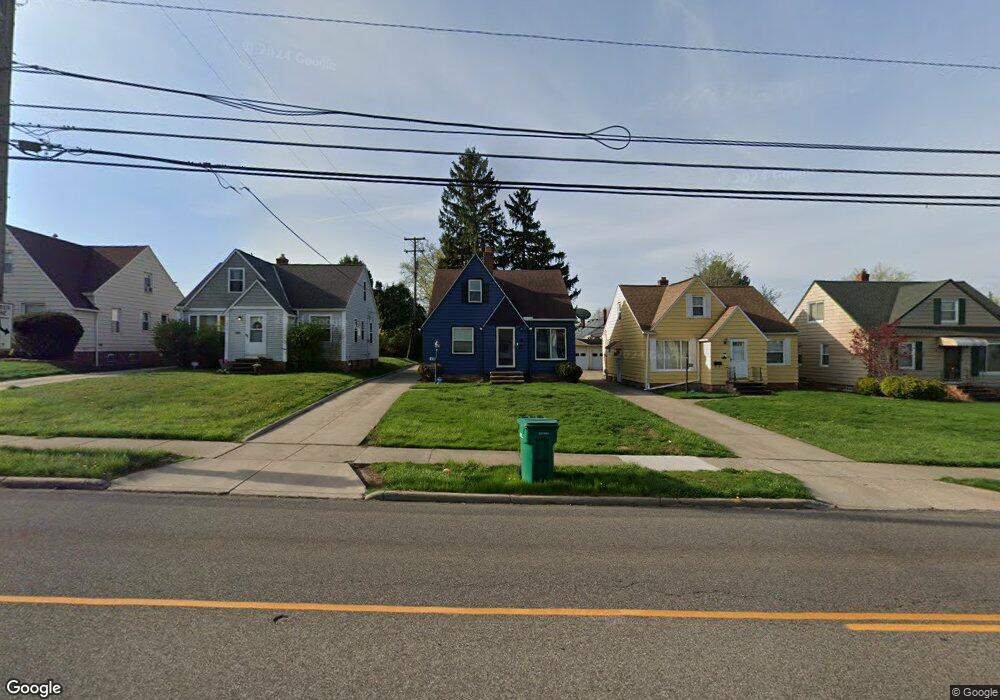
18708 Libby Rd Maple Heights, OH 44137
Estimated Value: $114,337 - $147,000
3
Beds
1
Bath
1,188
Sq Ft
$112/Sq Ft
Est. Value
About This Home
This home is located at 18708 Libby Rd, Maple Heights, OH 44137 and is currently estimated at $133,584, approximately $112 per square foot. 18708 Libby Rd is a home located in Cuyahoga County with nearby schools including Abraham Lincoln Elementary School, Rockside/ J.F. Kennedy School, and Barack Obama School.
Ownership History
Date
Name
Owned For
Owner Type
Purchase Details
Closed on
Dec 9, 1999
Sold by
Scott Colleen V
Bought by
Scott Colleen and Scott Eric
Current Estimated Value
Home Financials for this Owner
Home Financials are based on the most recent Mortgage that was taken out on this home.
Original Mortgage
$83,725
Outstanding Balance
$32,654
Interest Rate
11.15%
Estimated Equity
$100,930
Purchase Details
Closed on
Nov 20, 1998
Sold by
Scarville Eloise
Bought by
Scott Colleen
Purchase Details
Closed on
Sep 5, 1997
Sold by
Est Jeannette Reese
Bought by
Scarville Eloise
Home Financials for this Owner
Home Financials are based on the most recent Mortgage that was taken out on this home.
Original Mortgage
$65,250
Interest Rate
7.1%
Mortgage Type
New Conventional
Purchase Details
Closed on
Jan 14, 1986
Sold by
Rees Carl G
Bought by
Rees Jeanette
Purchase Details
Closed on
Nov 7, 1983
Sold by
Rees Carl G and Rees Jeanette
Bought by
Rees Carl G
Purchase Details
Closed on
Jan 1, 1975
Bought by
Rees Carl G and Rees Jeanette
Create a Home Valuation Report for This Property
The Home Valuation Report is an in-depth analysis detailing your home's value as well as a comparison with similar homes in the area
Home Values in the Area
Average Home Value in this Area
Purchase History
| Date | Buyer | Sale Price | Title Company |
|---|---|---|---|
| Scott Colleen | -- | -- | |
| Scott Colleen | -- | -- | |
| Scarville Eloise | $72,500 | -- | |
| Rees Jeanette | -- | -- | |
| Rees Carl G | -- | -- | |
| Rees Carl G | -- | -- |
Source: Public Records
Mortgage History
| Date | Status | Borrower | Loan Amount |
|---|---|---|---|
| Open | Scott Colleen | $83,725 | |
| Previous Owner | Scarville Eloise | $65,250 |
Source: Public Records
Tax History
| Year | Tax Paid | Tax Assessment Tax Assessment Total Assessment is a certain percentage of the fair market value that is determined by local assessors to be the total taxable value of land and additions on the property. | Land | Improvement |
|---|---|---|---|---|
| 2024 | $3,392 | $37,870 | $5,390 | $32,480 |
| 2023 | $2,648 | $24,650 | $4,590 | $20,060 |
| 2022 | $2,627 | $25,130 | $4,590 | $20,550 |
| 2021 | $2,803 | $25,130 | $4,590 | $20,550 |
| 2020 | $2,388 | $19,040 | $3,470 | $15,580 |
| 2019 | $2,377 | $54,400 | $9,900 | $44,500 |
| 2018 | $2,425 | $19,040 | $3,470 | $15,580 |
| 2017 | $2,353 | $18,520 | $4,520 | $14,000 |
| 2016 | $2,277 | $18,520 | $4,520 | $14,000 |
| 2015 | $2,286 | $18,520 | $4,520 | $14,000 |
| 2014 | $2,286 | $20,340 | $4,970 | $15,370 |
Source: Public Records
Map
Nearby Homes
- 18715 Libby Rd
- 18909 Maple Heights Blvd
- 5357 Beechwood Ave
- 5409 Hollywood Ave
- 5194 Homewood Ave
- 5219 Joseph St
- 5239 Arch St
- 17914 Libby Rd
- 18207 Mapleboro Ave
- 5165 Camden Rd
- 17916 North Blvd
- 19520 Maple Heights Blvd
- 19289 Stafford Ave
- 18990 Raymond St
- 18851 Raymond St
- 5177 Cato St
- 5100 Erwin St
- 5150 Arch St
- 18217 Edinboro Ave
- 18704 Longview Ave
- 18712 Libby Rd
- 18704 Libby Rd
- 18614 Libby Rd
- 18716 Libby Rd
- 5314 Hollywood Ave
- 5311 Elmwood Ave
- 5318 Hollywood Ave
- 5315 Elmwood Ave
- 5322 Hollywood Ave
- 18610 Libby Rd
- 5319 Elmwood Ave
- 18707 Libby Rd
- 18617 Libby Rd
- 5326 Hollywood Ave
- 18703 Libby Rd
- 5310 Elmwood Ave
- 18606 Libby Rd
- 5323 Elmwood Ave
- 5330 Hollywood Ave
- 18607 Libby Rd
Your Personal Tour Guide
Ask me questions while you tour the home.