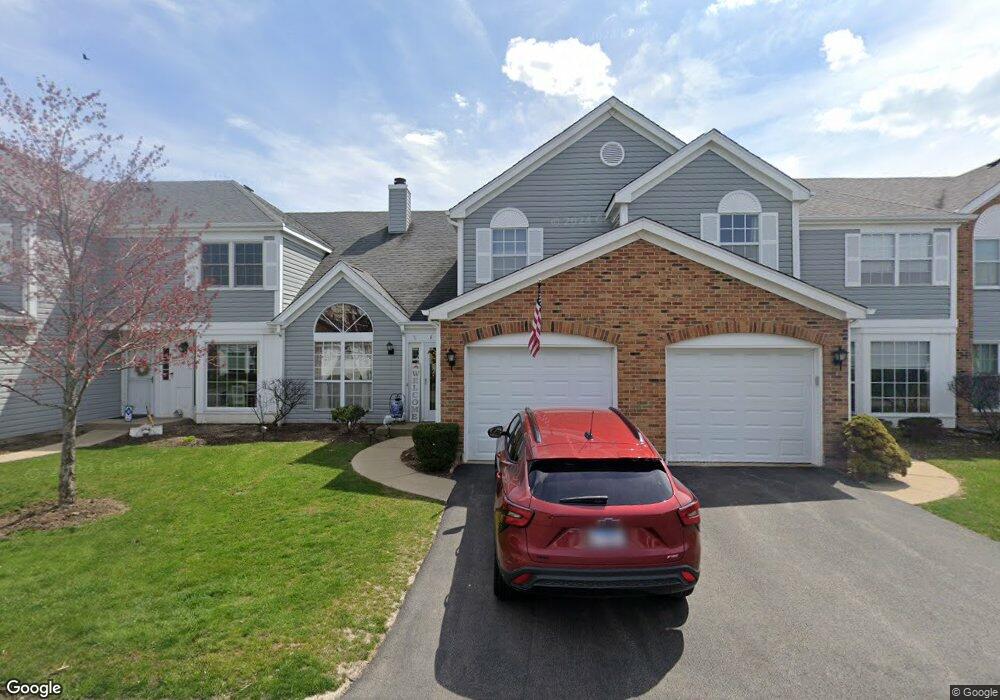
1871 Independence Ct Unit 2A Gurnee, IL 60031
Estimated Value: $240,000 - $267,000
2
Beds
2
Baths
1,432
Sq Ft
$177/Sq Ft
Est. Value
About This Home
This home is located at 1871 Independence Ct Unit 2A, Gurnee, IL 60031 and is currently estimated at $253,401, approximately $176 per square foot. 1871 Independence Ct Unit 2A is a home located in Lake County with nearby schools including Woodland Primary School, Woodland Intermediate School, and Woodland Elementary School.
Ownership History
Date
Name
Owned For
Owner Type
Purchase Details
Closed on
Feb 18, 2005
Sold by
Knutson Kristine A
Bought by
Knutson Kristine A and Kristine A Knutson Trust Agree
Current Estimated Value
Purchase Details
Closed on
Aug 25, 2003
Sold by
Will Philip J and Will Deborah J A
Bought by
Knutson Kristine A
Home Financials for this Owner
Home Financials are based on the most recent Mortgage that was taken out on this home.
Original Mortgage
$127,800
Interest Rate
6.49%
Mortgage Type
Purchase Money Mortgage
Purchase Details
Closed on
Nov 30, 1998
Sold by
Grief Andrea J
Bought by
Will Philip J and Will Deborah J A
Home Financials for this Owner
Home Financials are based on the most recent Mortgage that was taken out on this home.
Original Mortgage
$115,802
Interest Rate
6.83%
Mortgage Type
FHA
Create a Home Valuation Report for This Property
The Home Valuation Report is an in-depth analysis detailing your home's value as well as a comparison with similar homes in the area
Home Values in the Area
Average Home Value in this Area
Purchase History
| Date | Buyer | Sale Price | Title Company |
|---|---|---|---|
| Knutson Kristine A | -- | -- | |
| Knutson Kristine A | $160,000 | Chicago Title Insurance Comp | |
| Will Philip J | $118,500 | -- |
Source: Public Records
Mortgage History
| Date | Status | Borrower | Loan Amount |
|---|---|---|---|
| Previous Owner | Knutson Kristine A | $127,800 | |
| Previous Owner | Will Philip J | $115,802 |
Source: Public Records
Tax History
| Year | Tax Paid | Tax Assessment Tax Assessment Total Assessment is a certain percentage of the fair market value that is determined by local assessors to be the total taxable value of land and additions on the property. | Land | Improvement |
|---|---|---|---|---|
| 2024 | $6,050 | $69,174 | $10,560 | $58,614 |
| 2023 | $5,339 | $60,587 | $9,249 | $51,338 |
| 2022 | $5,339 | $53,895 | $8,179 | $45,716 |
| 2021 | $4,841 | $51,733 | $7,851 | $43,882 |
| 2020 | $4,691 | $50,461 | $7,658 | $42,803 |
| 2019 | $4,561 | $48,996 | $7,436 | $41,560 |
| 2018 | $4,249 | $46,162 | $3,962 | $42,200 |
| 2017 | $4,207 | $44,839 | $3,848 | $40,991 |
| 2016 | $4,185 | $42,843 | $3,677 | $39,166 |
| 2015 | $4,092 | $40,632 | $3,487 | $37,145 |
| 2014 | $3,890 | $38,918 | $3,440 | $35,478 |
| 2012 | $2,980 | $39,216 | $3,466 | $35,750 |
Source: Public Records
Map
Nearby Homes
- 1879 Independence Ct
- 1875 Independence Ct
- 1830 Princeton Ct
- 2001 Madison Ave
- 5875 Constitution Ave
- 5315 Cypress Cir
- 36537 N Fox Hill Dr
- 0 Tri State Pkwy
- 36625 N Kimberwick Ln
- 1999 N Fuller Rd
- 1357 Sunrise Ln Unit 15
- 1367 Stratford Dr Unit 1D
- 16655 W Applewood Ct
- 5140 Coventry Ln Unit 9A2
- 2510 Bayswater Cir
- 5149 Coventry Ln Unit 6-B-1
- 0 Hunt Club Rd Unit MRD12261326
- 36396 N Skokie Hwy
- 5080 Prairie Oak Rd
- 37181 N Fox Hill Dr
- 1871 Independence Ct
- 1867 Independence Ct
- 1863 Independence Ct
- 1863 Independence Ct Unit 2A
- 1877 Canterbury Ct
- 1873 Canterbury Ct
- 1883 Independence Ct
- 1885 Canterbury Ct
- 1869 Canterbury Ct
- 1868 Independence Ct Unit 2A
- 1864 Independence Ct
- 1872 Independence Ct
- 1876 Independence Ct
- 1860 Independence Ct
- 5910 Delaware Ave
- 5904 Delaware Ave
- 5916 Delaware Ave
- 5898 Delaware Ave Unit 2A
- 1880 Independence Ct
- 5892 Delaware Ave
Your Personal Tour Guide
Ask me questions while you tour the home.