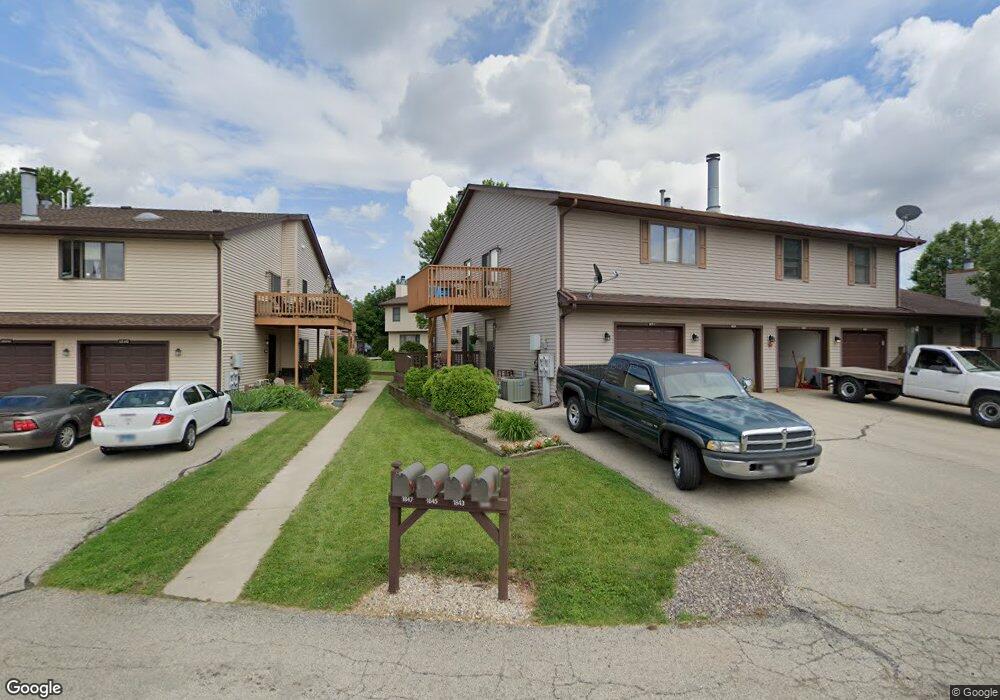
1871 Kerrybrook Ct Sycamore, IL 60178
Estimated Value: $174,000 - $190,000
2
Beds
2
Baths
--
Sq Ft
915
Sq Ft Lot
About This Home
This home is located at 1871 Kerrybrook Ct, Sycamore, IL 60178 and is currently estimated at $182,118. 1871 Kerrybrook Ct is a home located in DeKalb County with nearby schools including Sycamore High School, Cornerstone Christian Academy, and St Mary's Catholic School.
Ownership History
Date
Name
Owned For
Owner Type
Purchase Details
Closed on
Feb 20, 2015
Sold by
Butts Thomas G
Bought by
Butts Heather M
Current Estimated Value
Purchase Details
Closed on
Apr 7, 2010
Sold by
Home Loan Services Inc
Bought by
Butts Thomas G and Butts Heather M
Home Financials for this Owner
Home Financials are based on the most recent Mortgage that was taken out on this home.
Original Mortgage
$50,000
Interest Rate
5.14%
Mortgage Type
New Conventional
Purchase Details
Closed on
Dec 30, 2009
Sold by
Dekalb County Sheriff
Bought by
Us Bank Na
Purchase Details
Closed on
Oct 31, 2006
Sold by
Lenschow Amy S
Bought by
Schroeder Todd R
Home Financials for this Owner
Home Financials are based on the most recent Mortgage that was taken out on this home.
Original Mortgage
$95,920
Interest Rate
6.45%
Mortgage Type
Balloon
Create a Home Valuation Report for This Property
The Home Valuation Report is an in-depth analysis detailing your home's value as well as a comparison with similar homes in the area
Home Values in the Area
Average Home Value in this Area
Purchase History
| Date | Buyer | Sale Price | Title Company |
|---|---|---|---|
| Butts Heather M | -- | Chicago Title | |
| Butts Thomas G | $82,000 | -- | |
| Us Bank Na | -- | -- | |
| Schroeder Todd R | $116,500 | -- |
Source: Public Records
Mortgage History
| Date | Status | Borrower | Loan Amount |
|---|---|---|---|
| Previous Owner | Butts Thomas G | $50,000 | |
| Previous Owner | Schroeder Todd R | $95,920 |
Source: Public Records
Tax History
| Year | Tax Paid | Tax Assessment Tax Assessment Total Assessment is a certain percentage of the fair market value that is determined by local assessors to be the total taxable value of land and additions on the property. | Land | Improvement |
|---|---|---|---|---|
| 2024 | $2,964 | $44,640 | $1,772 | $42,868 |
| 2023 | $2,964 | $38,922 | $1,545 | $37,377 |
| 2022 | $2,788 | $35,536 | $1,411 | $34,125 |
| 2021 | $2,624 | $33,329 | $1,323 | $32,006 |
| 2020 | $2,608 | $32,798 | $1,302 | $31,496 |
| 2019 | $2,502 | $31,509 | $1,251 | $30,258 |
| 2018 | $2,438 | $30,441 | $1,209 | $29,232 |
| 2017 | $2,363 | $29,262 | $1,162 | $28,100 |
| 2016 | $2,346 | $28,524 | $1,133 | $27,391 |
| 2015 | -- | $27,027 | $1,074 | $25,953 |
| 2014 | -- | $27,288 | $1,554 | $25,734 |
| 2013 | -- | $28,664 | $1,632 | $27,032 |
Source: Public Records
Map
Nearby Homes
- 2123 Fairland Dr
- 1729 Raintree Ct Unit 92
- Lots 700-900 Ridge Dr
- 0000 Coltonville Rd
- Lots 1 & 2 Dekalb Ave
- 1824 Huckleberry Ln
- 2315 Hickory Ln
- 1122 Yorkshire Dr S
- 1755 Brock Cir
- Lot 7 Aberdeen Ct
- Lot 104 Aberdeen Ct
- 1235 Hathaway Dr
- 734 Anjali Ct Unit L
- 1208 Foxpointe Dr
- Lot 4 W Prairie Dr
- 625 Anjali Ct Unit L
- 617 Anjali Ct
- 618 Anjali Ct
- 932 Foxpointe Dr
- 809 Constance Ln
- 1846 Kerrybrook Ct
- 1846 Kerrybrook Ct Unit 1846
- 1869 Kerrybrook Ct
- 1844 Kerrybrook Ct
- 1867 Kerrybrook Ct
- 1865 Kerrybrook Ct
- 1842 Kerrybrook Ct
- 1842 Kerrybrook Ct Unit 2
- 1863 Kerrybrook Ct
- 1851 Kerrybrook Ct
- 1840 Kerrybrook Ct
- 1861 Kerrybrook Ct
- 1859 Kerrybrook Ct
- 1838 Kerrybrook Ct
- 1857 Kerrybrook Ct
- 1836 Kerrybrook Ct
- 1855 Kerrybrook Ct
- 1853 Kerrybrook Ct
- 1834 Kerrybrook Ct
- 1834 Kerrybrook Ct Unit 2
Your Personal Tour Guide
Ask me questions while you tour the home.