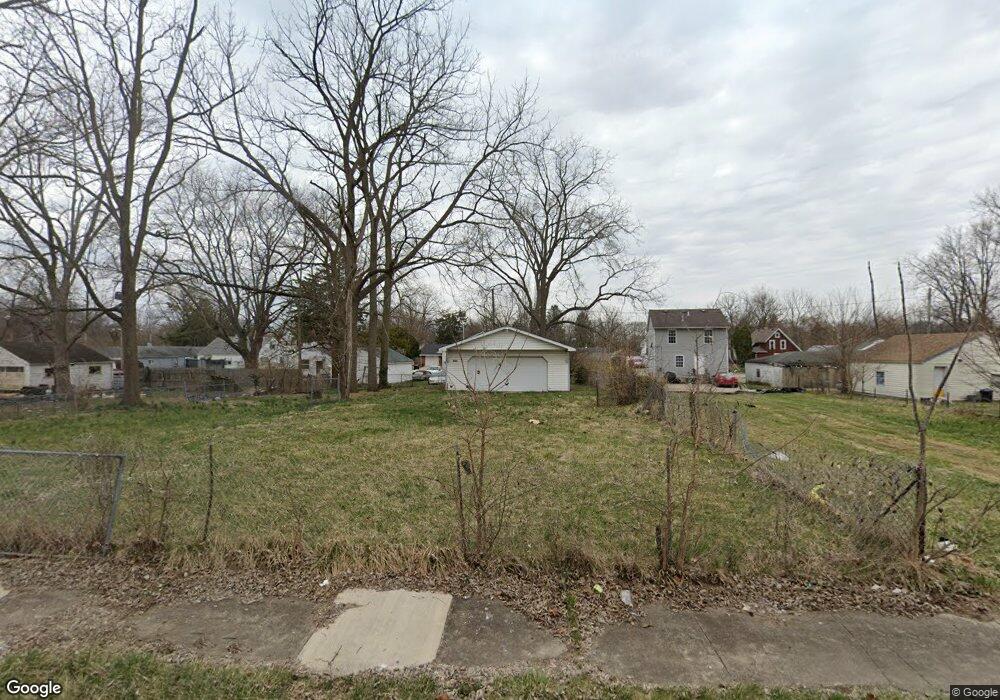
1871 Springmont Ave Springfield, OH 45506
Estimated Value: $62,000 - $93,000
1
Bed
1
Bath
520
Sq Ft
$146/Sq Ft
Est. Value
About This Home
This home is located at 1871 Springmont Ave, Springfield, OH 45506 and is currently estimated at $76,069, approximately $146 per square foot. 1871 Springmont Ave is a home located in Clark County with nearby schools including Fulton Elementary School, Hayward Middle School, and Springfield High School.
Ownership History
Date
Name
Owned For
Owner Type
Purchase Details
Closed on
Nov 1, 2023
Sold by
Givens Ronnie and Givens Donna Jean
Bought by
Whitaker Hauling Llc
Current Estimated Value
Purchase Details
Closed on
Sep 18, 2012
Sold by
Hart Barbara G
Bought by
Givens Ronnie
Purchase Details
Closed on
Jun 16, 2009
Sold by
L E S Management Llc
Bought by
Hart Barbara G
Purchase Details
Closed on
Jun 8, 2009
Sold by
Wagner Les
Bought by
Po Box 1052
Purchase Details
Closed on
Dec 4, 2007
Sold by
Squire Henry and Squire Christine
Bought by
Wagner Les
Purchase Details
Closed on
Feb 1, 1996
Sold by
Gilbert Larry J
Bought by
Squire Henry and Squire Christine
Purchase Details
Closed on
Mar 31, 1995
Sold by
Shrf Barbara E Martin Pr
Bought by
Beneficial Mortgage Co
Create a Home Valuation Report for This Property
The Home Valuation Report is an in-depth analysis detailing your home's value as well as a comparison with similar homes in the area
Home Values in the Area
Average Home Value in this Area
Purchase History
| Date | Buyer | Sale Price | Title Company |
|---|---|---|---|
| Whitaker Hauling Llc | -- | Team Title & Closing Services | |
| Whitaker Hauling Llc | -- | Team Title & Closing Services | |
| Givens Ronnie | $7,500 | None Available | |
| Hart Barbara G | -- | None Available | |
| Po Box 1052 | -- | None Available | |
| Wagner Les | $8,000 | None Available | |
| Squire Henry | $25,000 | -- | |
| Beneficial Mortgage Co | $11,000 | -- |
Source: Public Records
Mortgage History
| Date | Status | Borrower | Loan Amount |
|---|---|---|---|
| Closed | Squire Henry | $0 |
Source: Public Records
Tax History
| Year | Tax Paid | Tax Assessment Tax Assessment Total Assessment is a certain percentage of the fair market value that is determined by local assessors to be the total taxable value of land and additions on the property. | Land | Improvement |
|---|---|---|---|---|
| 2025 | $1,182 | $7,420 | $3,310 | $4,110 |
| 2024 | $833 | $6,230 | $3,090 | $3,140 |
| 2023 | $735 | $6,230 | $3,090 | $3,140 |
| 2022 | $1,533 | $6,230 | $3,090 | $3,140 |
| 2021 | $532 | $5,500 | $2,360 | $3,140 |
| 2020 | $532 | $5,500 | $2,360 | $3,140 |
| 2019 | $304 | $5,500 | $2,360 | $3,140 |
| 2018 | $316 | $5,490 | $2,360 | $3,130 |
| 2017 | $316 | $5,489 | $2,363 | $3,126 |
| 2016 | $316 | $5,489 | $2,363 | $3,126 |
| 2015 | $499 | $5,489 | $2,363 | $3,126 |
| 2014 | $321 | $5,489 | $2,363 | $3,126 |
| 2013 | $317 | $5,489 | $2,363 | $3,126 |
Source: Public Records
Map
Nearby Homes
- 1920 Russell Ave
- 2140 Shawnee Ave
- 550 W Parkwood Ave
- 1730 Damascus Ave
- 1515 W Perrin Ave
- 2301 Duquesne Dr
- 929 S Western Ave
- 802 Innisfallen Ave
- 1109 Montgomery Ave
- 506 W Southern Ave
- 405 W Southern Ave
- 830 Dibert Ave
- 1619 S Center Blvd
- 311 W Grand Ave
- 0 Montgomery Ave
- 410 W Liberty St
- 1754 S Fountain Ave
- 209 W Liberty St
- 1355 S Fountain Ave
- 525 S Light St
- 1867 Springmont Ave
- 1905 Springmont Ave
- 1865 Springmont Ave
- 1824 Norwood Ave
- 1828 Norwood Ave
- 1909 Springmont Ave
- 1909 Springmont Ave
- 1822 Norwood Ave
- 1836 Norwood Ave
- 1906 Springmont Ave
- 1810 1/2 Norwood Ave
- 1872 Springmont Ave
- 1868 Springmont Ave
- 1840 Norwood Ave
- 1853 Springmont Ave
- 1853 Springmont Ave
- 1917 Springmont Ave
- 1810 Norwood Ave
- 1914 Springmont Ave
- 1919 Springmont Ave
Your Personal Tour Guide
Ask me questions while you tour the home.